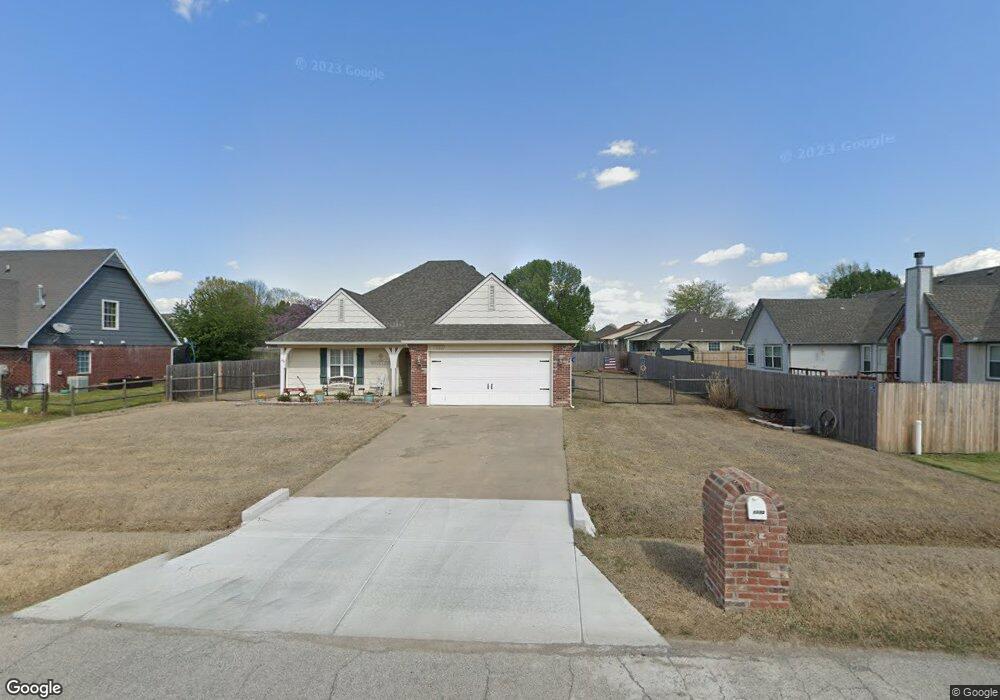
1133 S Quail Creek Rd Skiatook, OK 74070
Estimated Value: $220,213 - $253,000
3
Beds
2
Baths
1,429
Sq Ft
$163/Sq Ft
Est. Value
About This Home
This home is located at 1133 S Quail Creek Rd, Skiatook, OK 74070 and is currently estimated at $233,303, approximately $163 per square foot. 1133 S Quail Creek Rd is a home located in Osage County with nearby schools including Marrs Elementary School, Newman Middle School, and Skiatook High School.
Ownership History
Date
Name
Owned For
Owner Type
Purchase Details
Closed on
Mar 31, 2005
Sold by
Stowers Investments Llc
Bought by
Barton Marsha L
Current Estimated Value
Home Financials for this Owner
Home Financials are based on the most recent Mortgage that was taken out on this home.
Original Mortgage
$99,900
Outstanding Balance
$51,116
Interest Rate
5.75%
Mortgage Type
New Conventional
Estimated Equity
$182,187
Purchase Details
Closed on
May 24, 2004
Sold by
J C Real Estate Investments
Bought by
Stowers Investments Llc
Purchase Details
Closed on
Sep 27, 2002
Sold by
Roberts Jimmy D Rev Trust
Bought by
J C Real Estate Investments
Purchase Details
Closed on
Jan 5, 2001
Sold by
Black Dog Properties Llc An Oklahoma
Bought by
Roberts Jimmy D Rev Trust
Purchase Details
Closed on
Jan 6, 2000
Sold by
Southfield Llc
Bought by
Black Dog Properties Llc An Oklahoma
Create a Home Valuation Report for This Property
The Home Valuation Report is an in-depth analysis detailing your home's value as well as a comparison with similar homes in the area
Home Values in the Area
Average Home Value in this Area
Purchase History
| Date | Buyer | Sale Price | Title Company |
|---|---|---|---|
| Barton Marsha L | $120,000 | -- | |
| Stowers Investments Llc | $13,500 | -- | |
| J C Real Estate Investments | -- | -- | |
| Roberts Jimmy D Rev Trust | -- | -- | |
| Black Dog Properties Llc An Oklahoma | -- | -- |
Source: Public Records
Mortgage History
| Date | Status | Borrower | Loan Amount |
|---|---|---|---|
| Open | Barton Marsha L | $99,900 |
Source: Public Records
Tax History Compared to Growth
Tax History
| Year | Tax Paid | Tax Assessment Tax Assessment Total Assessment is a certain percentage of the fair market value that is determined by local assessors to be the total taxable value of land and additions on the property. | Land | Improvement |
|---|---|---|---|---|
| 2025 | $1,526 | $16,050 | $1,701 | $14,349 |
| 2024 | $1,526 | $15,286 | $1,620 | $13,666 |
| 2023 | $1,526 | $15,286 | $1,620 | $13,666 |
| 2022 | $1,514 | $15,286 | $1,620 | $13,666 |
| 2021 | $1,519 | $15,286 | $1,620 | $13,666 |
| 2020 | $1,497 | $14,967 | $1,620 | $13,347 |
| 2019 | $1,515 | $14,967 | $1,620 | $13,347 |
| 2018 | $1,509 | $14,967 | $1,620 | $13,347 |
| 2017 | $1,478 | $14,445 | $1,620 | $12,825 |
| 2016 | $1,482 | $14,431 | $1,620 | $12,811 |
| 2015 | $1,400 | $13,743 | $1,620 | $12,123 |
| 2014 | $1,332 | $13,747 | $1,620 | $12,127 |
| 2013 | $1,325 | $13,681 | $1,620 | $12,061 |
Source: Public Records
Map
Nearby Homes
- 1128 S Quail Creek Rd
- 1122 W Beech St
- 618 S Shawnee St
- 619 S Seminole St
- 613 S Seminole St
- 1122 S Russell St
- 1127 S Russell St
- 808 W 5th St
- 0 W 4th St Unit 2510752
- 715 W 4th St
- 0 Bulldog St
- 3618 W Evergreen St
- 724 S Haynie St
- 133 W Chestnut Place
- 3629 W Forest St
- 1915 S Lenapah
- 127 W 135th St N
- 10 N Lenapah St
- 2100 S Haynie Ct
- 1216 S A St
- 1129 S Quail Creek Rd
- 1137 S Quail Creek Rd
- 1117 W Beech St
- 1128 S Mockingbird Cir
- 1125 S Quail Creek Rd
- 1132 S Quail Creek Rd
- 1140 S Javine Ave
- 1128 S Javine Ave
- 1132 S Javine Ave
- 1124 S Mockingbird Cir
- 1128 S Quail Creek Rd
- 1136 S Quail Creek Rd
- 1115 W Beech St
- 1121 S Quail Creek Rd
- 1120 W Beech St
- 1118 W Beech St
- 1140 S Quail Creek Rd
- 1124 S Quail Creek Rd
- 1120 S Mockingbird Cir
- 1113 W Beech St