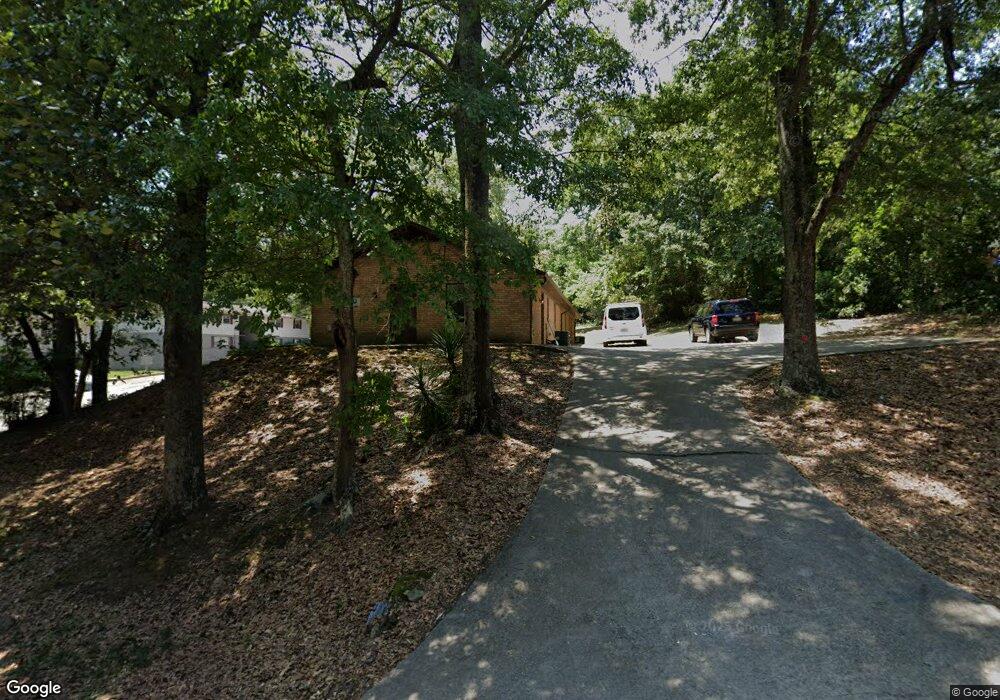
1133 Scott St SE Conyers, GA 30012
Estimated Value: $171,000 - $292,000
2
Beds
1
Bath
2,036
Sq Ft
$112/Sq Ft
Est. Value
About This Home
This home is located at 1133 Scott St SE, Conyers, GA 30012 and is currently estimated at $227,120, approximately $111 per square foot. 1133 Scott St SE is a home located in Rockdale County with nearby schools including Hicks Elementary School, Edwards Middle School, and Salem High School.
Ownership History
Date
Name
Owned For
Owner Type
Purchase Details
Closed on
Feb 27, 2020
Sold by
Moran Brian R
Bought by
Youngblood Brandon S
Current Estimated Value
Home Financials for this Owner
Home Financials are based on the most recent Mortgage that was taken out on this home.
Original Mortgage
$75,000
Outstanding Balance
$51,936
Interest Rate
3.5%
Mortgage Type
New Conventional
Estimated Equity
$175,184
Purchase Details
Closed on
Jan 19, 2005
Sold by
Wagner Donald A and Wagner Elizabeth
Bought by
Moran Brian R
Home Financials for this Owner
Home Financials are based on the most recent Mortgage that was taken out on this home.
Original Mortgage
$80,000
Interest Rate
5.62%
Mortgage Type
New Conventional
Purchase Details
Closed on
Oct 30, 1998
Sold by
Rabun Creg L
Bought by
Wagner Donald A and Wagner Eliz R
Create a Home Valuation Report for This Property
The Home Valuation Report is an in-depth analysis detailing your home's value as well as a comparison with similar homes in the area
Home Values in the Area
Average Home Value in this Area
Purchase History
| Date | Buyer | Sale Price | Title Company |
|---|---|---|---|
| Youngblood Brandon S | $100,000 | -- | |
| Moran Brian R | $109,000 | -- | |
| Wagner Donald A | $75,000 | -- |
Source: Public Records
Mortgage History
| Date | Status | Borrower | Loan Amount |
|---|---|---|---|
| Open | Youngblood Brandon S | $75,000 | |
| Previous Owner | Moran Brian R | $80,000 | |
| Closed | Wagner Donald A | -- |
Source: Public Records
Tax History Compared to Growth
Tax History
| Year | Tax Paid | Tax Assessment Tax Assessment Total Assessment is a certain percentage of the fair market value that is determined by local assessors to be the total taxable value of land and additions on the property. | Land | Improvement |
|---|---|---|---|---|
| 2024 | $4,383 | $70,000 | $18,400 | $51,600 |
| 2023 | $4,402 | $68,560 | $18,400 | $50,160 |
| 2022 | $3,081 | $44,800 | $10,480 | $34,320 |
| 2021 | $2,812 | $40,000 | $9,356 | $30,644 |
| 2020 | $2,320 | $29,080 | $4,200 | $24,880 |
| 2019 | $2,392 | $29,080 | $4,200 | $24,880 |
| 2018 | $1,311 | $29,080 | $4,200 | $24,880 |
| 2017 | $2,087 | $25,840 | $4,200 | $21,640 |
| 2016 | $2,097 | $25,840 | $4,200 | $21,640 |
| 2015 | $1,177 | $25,840 | $4,200 | $21,640 |
| 2014 | $1,190 | $25,840 | $4,200 | $21,640 |
| 2013 | -- | $29,760 | $7,480 | $22,280 |
Source: Public Records
Map
Nearby Homes
- 1110 Oakland Ave SE
- 871 Malcom St SE
- 998 Highland Cir SE
- 997 Highland Cir SE
- 988 Huff St SW
- 990 Oakland Ave SE
- 954 Bryant St SW
- 214 Seward St Unit 94
- 1146 Old Covington Hwy SE
- 948 Peek St NW
- 1269 Lark Ln NE
- 953 Remington Dr SE
- 1065 Milstead Ave NE
- 902 Andrews Dr NW
- 2022 Appaloosa Way
- 1532 Remington Ct SE
- 1098 Eastview Cir NE
- 893 Andrews Dr NW
- 928 Malcolm St
- 917 Malcolm St SE
- 917 Malcom St SE
- 928 Malcom St SE
- 924 Malcom St SE
- 920 Malcom St SE
- 0 Scott St SE
- 910 Oak Ln SE
- 911 Malcom St SE
- 914 Malcom St SE
- 910 Malcom St SE
- 905 Malcom St SE
- 910 Malcolm St SE
- 901 Malcom St SE
- 908 Oak Ln SE Unit 921
- 1061 Scott St SE
- 903 Oakland Ln SE
- 904 Malcom St SE
- 0 Oakland Ln
- 897 Malcom St SE