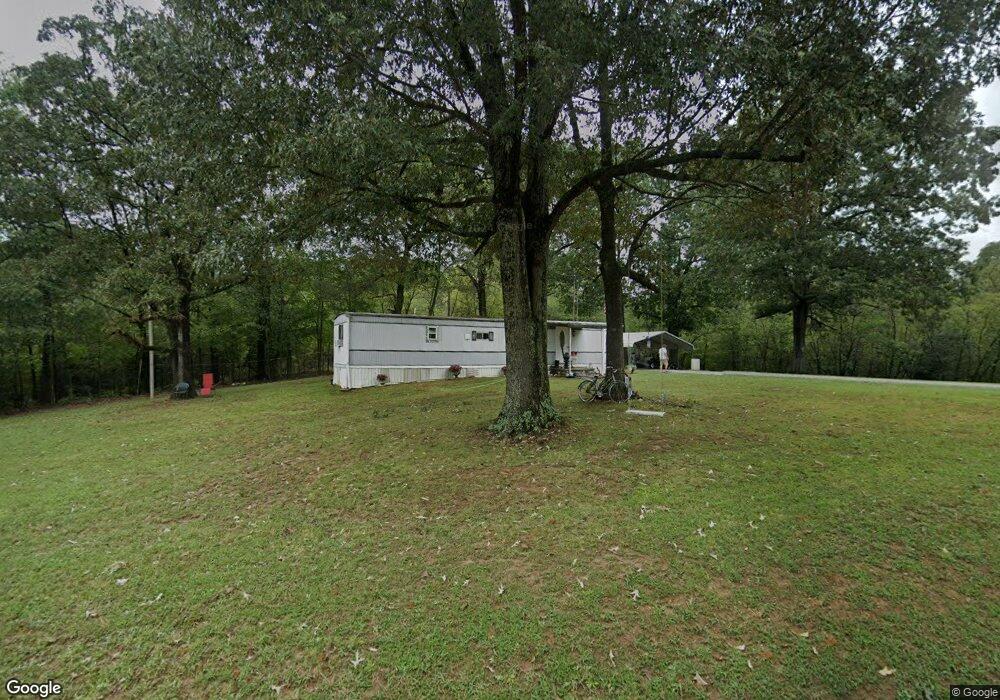
1133 Tubbs Rd Benton, KY 42025
Estimated Value: $51,403 - $131,000
2
Beds
1
Bath
720
Sq Ft
$129/Sq Ft
Est. Value
About This Home
This home is located at 1133 Tubbs Rd, Benton, KY 42025 and is currently estimated at $92,851, approximately $128 per square foot. 1133 Tubbs Rd is a home located in Marshall County with nearby schools including Jonathan Elementary School and Marshall County High School.
Ownership History
Date
Name
Owned For
Owner Type
Purchase Details
Closed on
Oct 25, 2023
Sold by
Cavitt Diane M and Cavitt Gary
Bought by
Culp Paul Michael and Culp Donna J
Current Estimated Value
Purchase Details
Closed on
Oct 16, 2023
Sold by
Oldfield Rollie T and Joyce Ann
Bought by
Oldfield Joyce Ann
Purchase Details
Closed on
Jun 19, 2018
Sold by
Rees Mike L and Rees Linda K
Bought by
Taylor Rodney Allan and Taylor Linda Faye
Purchase Details
Closed on
Sep 7, 2010
Sold by
Hercula Megan L and Hercula Kevin
Bought by
Rees Mike L and Rees Linda K
Purchase Details
Closed on
Sep 11, 2007
Sold by
Perry Teresa A and Perry Jeff
Bought by
Weck Megan L and Abbott Justin
Home Financials for this Owner
Home Financials are based on the most recent Mortgage that was taken out on this home.
Original Mortgage
$21,714
Interest Rate
6.55%
Mortgage Type
Future Advance Clause Open End Mortgage
Create a Home Valuation Report for This Property
The Home Valuation Report is an in-depth analysis detailing your home's value as well as a comparison with similar homes in the area
Home Values in the Area
Average Home Value in this Area
Purchase History
| Date | Buyer | Sale Price | Title Company |
|---|---|---|---|
| Culp Paul Michael | $50,000 | None Listed On Document | |
| Oldfield Joyce Ann | -- | None Listed On Document | |
| Taylor Rodney Allan | $22,000 | None Available | |
| Rees Mike L | $23,000 | None Available | |
| Weck Megan L | $25,000 | None Available |
Source: Public Records
Mortgage History
| Date | Status | Borrower | Loan Amount |
|---|---|---|---|
| Previous Owner | Weck Megan L | $21,714 |
Source: Public Records
Tax History Compared to Growth
Tax History
| Year | Tax Paid | Tax Assessment Tax Assessment Total Assessment is a certain percentage of the fair market value that is determined by local assessors to be the total taxable value of land and additions on the property. | Land | Improvement |
|---|---|---|---|---|
| 2024 | $262 | $26,000 | $16,000 | $10,000 |
| 2023 | $271 | $26,000 | $16,000 | $10,000 |
| 2022 | $282 | $26,000 | $16,000 | $10,000 |
| 2021 | $241 | $22,000 | $16,000 | $6,000 |
| 2020 | $243 | $22,000 | $16,000 | $6,000 |
| 2019 | $243 | $22,000 | $16,000 | $6,000 |
| 2018 | $232 | $23,000 | $17,200 | $5,800 |
| 2017 | $232 | $23,000 | $17,200 | $5,800 |
| 2016 | $233 | $23,000 | $17,200 | $5,800 |
| 2015 | $234 | $23,000 | $17,200 | $5,800 |
| 2014 | $234 | $23,000 | $0 | $0 |
| 2010 | -- | $25,000 | $15,700 | $9,300 |
Source: Public Records
Map
Nearby Homes
- Lot 10 Woodridge Subdivision
- Lot 11 Tradition Dr
- 000 Oak Level Rd
- Lot 19 Woodridge Subdivision
- 0 S Us Hwy 641 Unit 119132
- Lot 13 Gateway Village Subdivision
- Lot 4 Woodridge Subdivision
- 000 Palmer Dr
- Lot 7 Woodridge Subdivision
- 1795 Dunn Cemetery Rd
- 368 Moors Camp Hwy
- Lot 33 Woodtrace Subdivision
- Lot 34 & 35 Woodtrace Subdivision
- 1060 Big Bear Hwy
- 2.41 Acres on Main St
- 1208 Shelby McCallum Dr
- 1314 Shelby McCallum Dr
- 102 Harper Dr
- 1153 Briensburg Tatumsville Rd
- 10003 U S Highway 68 E
- 1147 Tubbs Rd
- 1181 Tubbs Rd
- 1158 Tubbs Rd
- 1138 Tubbs Rd
- 1164 Tubbs Rd
- 1233 Tubbs Rd
- 1021 Tubbs Rd
- 1032 Tubbs Rd
- 1258 Tubbs Rd
- 1261 Tubbs Rd
- 1304 Tubbs Rd
- 985 Tubbs Rd
- 921 Tubbs Rd
- 1328 Tubbs Rd
- 1319 Tubbs Rd
- 1394 Tubbs Rd
- 1397 Tubbs Rd
- 2577 Benton Birmingham Rd
- 2702 Benton Birmingham Rd
- 821 Tubbs Rd