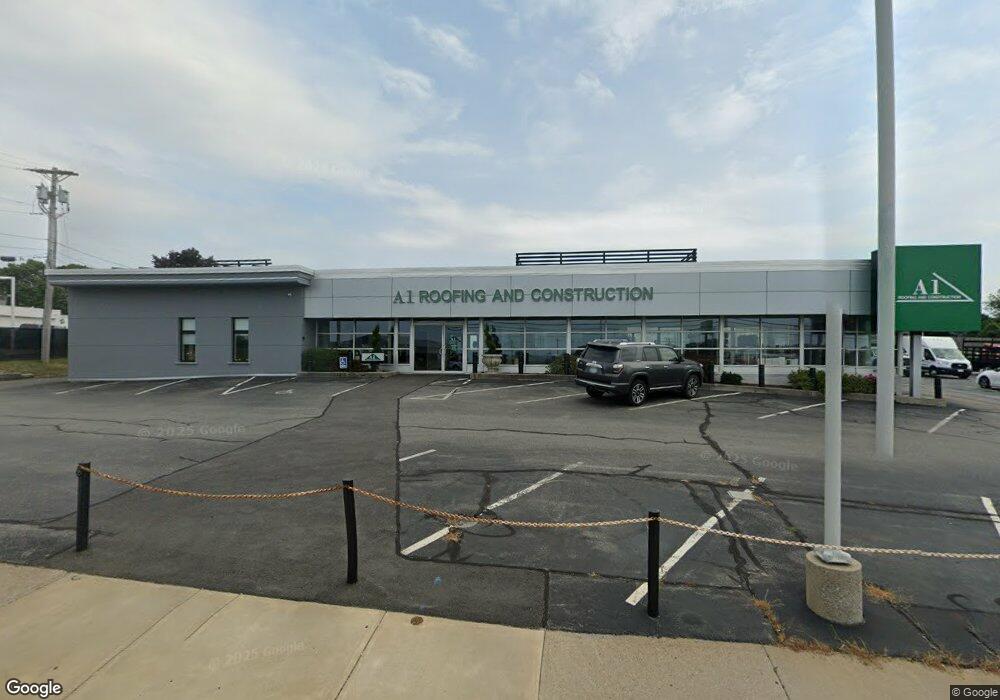
1133 W Main Rd Middletown, RI 02842
Estimated Value: $2,741,775
--
Bed
--
Bath
11,584
Sq Ft
$237/Sq Ft
Est. Value
About This Home
This home is located at 1133 W Main Rd, Middletown, RI 02842 and is currently estimated at $2,741,775, approximately $236 per square foot. 1133 W Main Rd is a home located in Newport County with nearby schools including Middletown High School and All Saints STEAM Academy.
Ownership History
Date
Name
Owned For
Owner Type
Purchase Details
Closed on
Dec 22, 2015
Sold by
Seguin Llc
Bought by
Ocean State Holdings
Current Estimated Value
Purchase Details
Closed on
Dec 7, 2011
Sold by
Ruggiero Paula A and Ruggiero Joseph
Bought by
Seguin Realty Llc
Home Financials for this Owner
Home Financials are based on the most recent Mortgage that was taken out on this home.
Original Mortgage
$829,158
Interest Rate
4.09%
Mortgage Type
Commercial
Purchase Details
Closed on
May 29, 1992
Sold by
Fairlawn Oil Svcs Inc
Bought by
Davart Inc
Create a Home Valuation Report for This Property
The Home Valuation Report is an in-depth analysis detailing your home's value as well as a comparison with similar homes in the area
Home Values in the Area
Average Home Value in this Area
Purchase History
| Date | Buyer | Sale Price | Title Company |
|---|---|---|---|
| Ocean State Holdings | $1,400,000 | -- | |
| Seguin Realty Llc | $2,000,000 | -- | |
| Davart Inc | $286,000 | -- |
Source: Public Records
Mortgage History
| Date | Status | Borrower | Loan Amount |
|---|---|---|---|
| Previous Owner | Davart Inc | $855,000 | |
| Previous Owner | Davart Inc | $829,158 | |
| Previous Owner | Davart Inc | $1,036,448 | |
| Previous Owner | Davart Inc | $300,000 |
Source: Public Records
Tax History Compared to Growth
Tax History
| Year | Tax Paid | Tax Assessment Tax Assessment Total Assessment is a certain percentage of the fair market value that is determined by local assessors to be the total taxable value of land and additions on the property. | Land | Improvement |
|---|---|---|---|---|
| 2025 | $27,449 | $2,019,800 | $1,183,700 | $836,100 |
| 2024 | $25,253 | $1,945,500 | $1,183,700 | $761,800 |
| 2023 | $25,339 | $1,355,000 | $579,300 | $775,700 |
| 2022 | $24,645 | $1,380,700 | $605,000 | $775,700 |
| 2021 | $23,789 | $1,380,700 | $605,000 | $775,700 |
| 2020 | $25,286 | $1,388,600 | $590,200 | $798,400 |
| 2018 | $25,273 | $1,388,600 | $590,200 | $798,400 |
| 2016 | $25,767 | $1,260,600 | $578,700 | $681,900 |
| 2015 | $25,162 | $1,260,600 | $578,700 | $681,900 |
| 2014 | $25,608 | $1,200,000 | $694,400 | $505,600 |
| 2013 | $25,044 | $1,200,000 | $694,400 | $505,600 |
Source: Public Records
Map
Nearby Homes
- 521 Forest Park
- 529 Forest Park
- 533 Forest Park
- 836 Forest Park
- 841 Forest Park
- 6 Wabasso Terrace
- 19 Cows Path Rd
- 74 Valley Rd
- 16 King Rd
- 481 Oliphant Ln
- 65 Maple Ave
- 17 Underwood Ln
- 0 Coggeshall Way
- 114 Maple Ave
- 67 Linden St
- 17 Mariner Way
- 18 J h Dwyer Dr
- 231 Maple Ave Unit 204
- 188 Greene Ln
- 149 W Main Rd