Estimated Value: $579,292
96
Beds
2
Baths
12,096
Sq Ft
$48/Sq Ft
Est. Value
About This Home
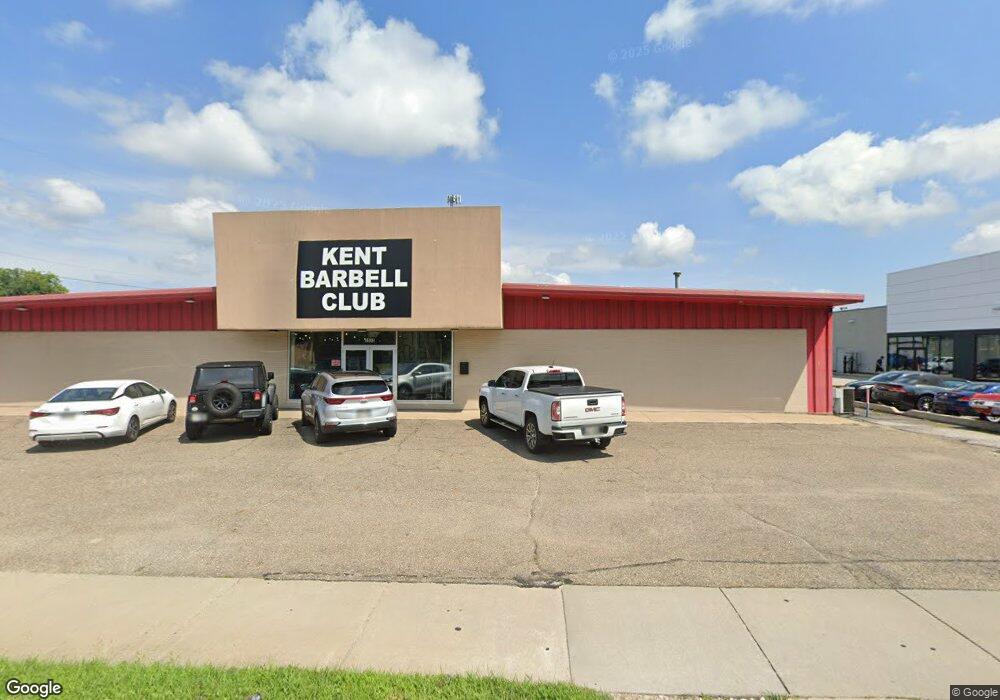
This home is located at 1133 W Main St, Kent, OH 44240 and is currently estimated at $579,292, approximately $47 per square foot. 1133 W Main St is a home located in Portage County with nearby schools including Harlean Beal Elementary School, Newgulf Elementary School, and Longcoy Elementary School.
Ownership History
Date
Name
Owned For
Owner Type
Purchase Details
Closed on
Jan 20, 2023
Sold by
Montrose Real Estate I Llc
Bought by
Wmkent Llc
Current Estimated Value
Home Financials for this Owner
Home Financials are based on the most recent Mortgage that was taken out on this home.
Original Mortgage
$424,500
Outstanding Balance
$404,132
Interest Rate
6.33%
Mortgage Type
New Conventional
Estimated Equity
$175,160
Purchase Details
Closed on
Aug 18, 2017
Sold by
Klaben Property Management Llc
Bought by
Montrose Real Estate I Llc
Purchase Details
Closed on
Feb 27, 2017
Sold by
Conaway Charles W and Conaway Joan M
Bought by
Kiaben Property Management Llc
Purchase Details
Closed on
Jul 10, 2015
Sold by
Conaway Charles W
Bought by
Conaway Joan M and Conaway Family Trust
Create a Home Valuation Report for This Property
The Home Valuation Report is an in-depth analysis detailing your home's value as well as a comparison with similar homes in the area
Home Values in the Area
Average Home Value in this Area
Purchase History
| Date | Buyer | Sale Price | Title Company |
|---|---|---|---|
| Wmkent Llc | -- | -- | |
| Montrose Real Estate I Llc | $200,000 | None Available | |
| Kiaben Property Management Llc | $299,000 | None Available | |
| Conaway Joan M | -- | Attorney |
Source: Public Records
Mortgage History
| Date | Status | Borrower | Loan Amount |
|---|---|---|---|
| Open | Wmkent Llc | $424,500 |
Source: Public Records
Tax History Compared to Growth
Tax History
| Year | Tax Paid | Tax Assessment Tax Assessment Total Assessment is a certain percentage of the fair market value that is determined by local assessors to be the total taxable value of land and additions on the property. | Land | Improvement |
|---|---|---|---|---|
| 2024 | $9,425 | $159,360 | $38,470 | $120,890 |
| 2023 | $6,513 | $94,540 | $38,470 | $56,070 |
| 2022 | $6,538 | $94,540 | $38,470 | $56,070 |
| 2021 | $6,644 | $94,540 | $38,470 | $56,070 |
| 2020 | $6,744 | $94,540 | $38,470 | $56,070 |
| 2019 | $6,771 | $94,540 | $38,470 | $56,070 |
| 2018 | $7,685 | $104,660 | $38,470 | $66,190 |
| 2017 | $7,685 | $104,660 | $38,470 | $66,190 |
| 2016 | $9,180 | $122,720 | $38,470 | $84,250 |
| 2015 | $9,399 | $122,720 | $38,470 | $84,250 |
| 2014 | $10,231 | $122,720 | $38,470 | $84,250 |
| 2013 | $10,634 | $122,720 | $38,470 | $84,250 |
Source: Public Records
Map
Nearby Homes
- 1157 W Main St
- 1171 W Main St
- 1169 W Main St
- 1136 W Main St
- 358 N Francis St
- 1170 W Main St
- 369 N Francis St
- 373 N Francis St
- 1147 Hampton Rd
- 1143 Hampton Rd
- 370 N Francis St
- 1181 W Main St
- 1131 Hampton Rd
- 1157 Hampton Rd
- 1127 Hampton Rd
- 378 N Francis St
- 1165 Hampton Rd
- 382 N Francis St
- 1180 W Main St
- 386 N Francis St