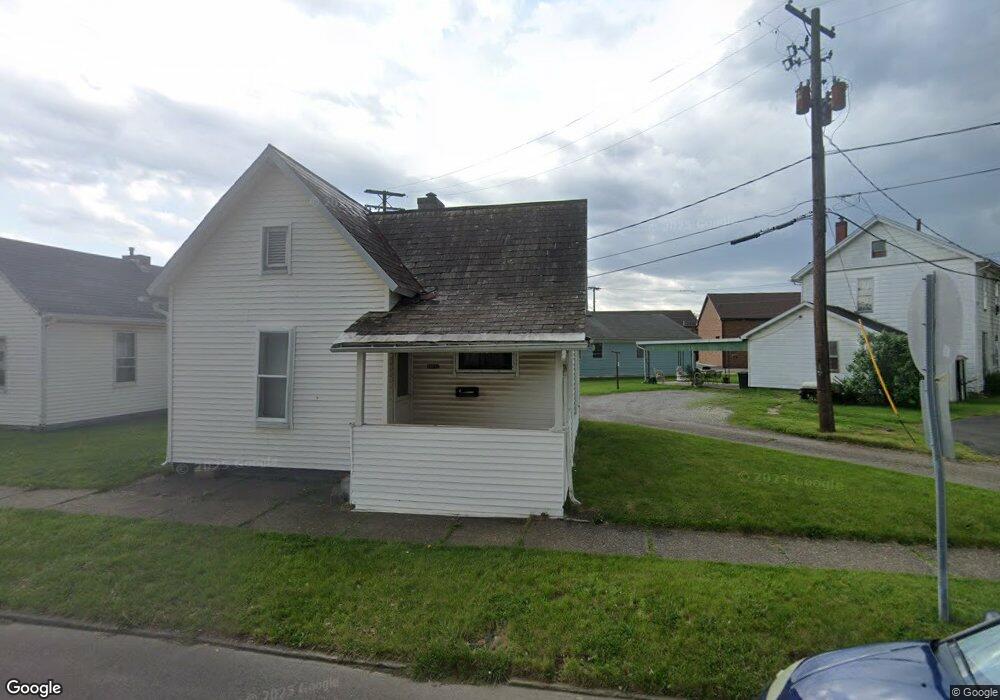
1133 Walnut St Coshocton, OH 43812
Estimated Value: $52,312 - $139,000
1
Bed
1
Bath
638
Sq Ft
$147/Sq Ft
Est. Value
About This Home
This home is located at 1133 Walnut St, Coshocton, OH 43812 and is currently estimated at $93,828, approximately $147 per square foot. 1133 Walnut St is a home located in Coshocton County with nearby schools including Coshocton High School, Coshocton Opportunity School, and Sacred Heart School.
Ownership History
Date
Name
Owned For
Owner Type
Purchase Details
Closed on
Sep 27, 2013
Sold by
Metz Norma R
Bought by
Frye Scott R
Current Estimated Value
Home Financials for this Owner
Home Financials are based on the most recent Mortgage that was taken out on this home.
Original Mortgage
$19,200
Outstanding Balance
$9,862
Interest Rate
4.5%
Mortgage Type
Future Advance Clause Open End Mortgage
Estimated Equity
$83,966
Purchase Details
Closed on
May 15, 2003
Sold by
Metz John
Bought by
Metz John E Trust Agreement
Purchase Details
Closed on
May 6, 2003
Sold by
Metz Norma
Bought by
Metz John
Create a Home Valuation Report for This Property
The Home Valuation Report is an in-depth analysis detailing your home's value as well as a comparison with similar homes in the area
Home Values in the Area
Average Home Value in this Area
Purchase History
| Date | Buyer | Sale Price | Title Company |
|---|---|---|---|
| Frye Scott R | $24,000 | None Available | |
| Metz John E Trust Agreement | -- | -- | |
| Metz John | -- | -- |
Source: Public Records
Mortgage History
| Date | Status | Borrower | Loan Amount |
|---|---|---|---|
| Open | Frye Scott R | $19,200 |
Source: Public Records
Tax History Compared to Growth
Tax History
| Year | Tax Paid | Tax Assessment Tax Assessment Total Assessment is a certain percentage of the fair market value that is determined by local assessors to be the total taxable value of land and additions on the property. | Land | Improvement |
|---|---|---|---|---|
| 2024 | $239 | $5,620 | $970 | $4,650 |
| 2023 | $239 | $4,421 | $746 | $3,675 |
| 2022 | $221 | $4,421 | $746 | $3,675 |
| 2021 | $222 | $4,421 | $746 | $3,675 |
| 2020 | $369 | $7,210 | $728 | $6,482 |
| 2019 | $373 | $7,210 | $728 | $6,482 |
| 2018 | $371 | $7,210 | $728 | $6,482 |
| 2017 | $381 | $7,161 | $679 | $6,482 |
| 2016 | $366 | $7,161 | $679 | $6,482 |
| 2015 | $184 | $7,161 | $679 | $6,482 |
| 2014 | $339 | $7,025 | $903 | $6,122 |
Source: Public Records
Map
Nearby Homes