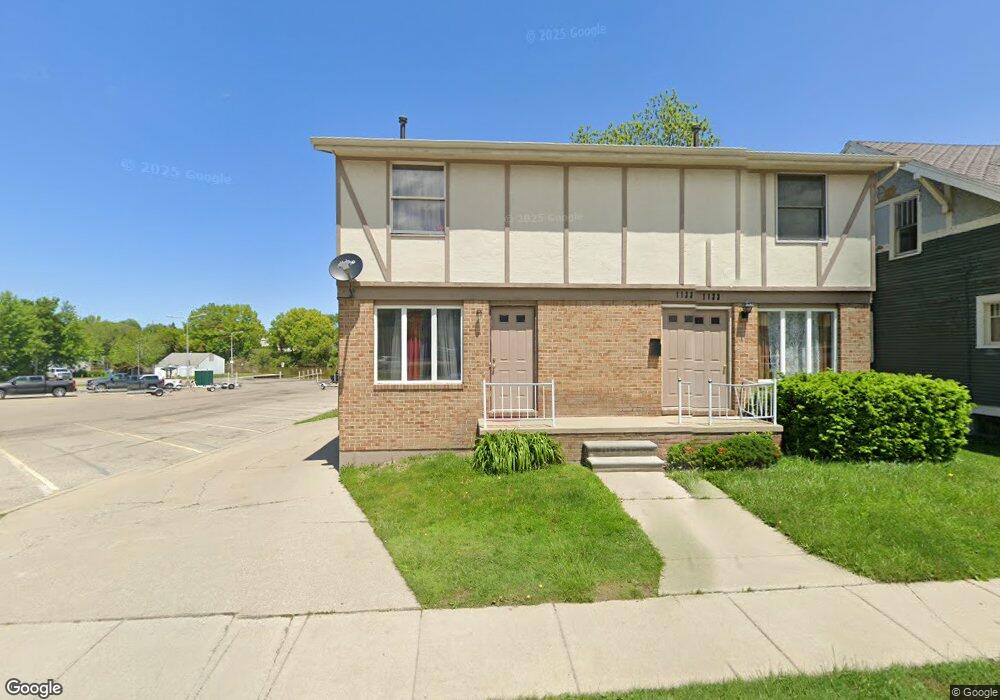
1133 Water St Port Huron, MI 48060
Estimated Value: $231,000 - $269,184
2
Beds
2
Baths
980
Sq Ft
$261/Sq Ft
Est. Value
About This Home
Great two bedroom townhouse located steps from the Black River in Port Huron. $975.00 per month plus gas electric and water. Stainless steel appliances. Full basement with washer dryer hook up. All applicants must be currently working with current employer for a minimum of one year. Good rental history. No eviction or monies due to any landlords. No pets allowed. Lawn and snow care provided.
Ownership History
Date
Name
Owned For
Owner Type
Purchase Details
Closed on
Sep 20, 2019
Sold by
Mc Soule Enterprises Llc
Bought by
Black River Properties Llc
Current Estimated Value
Purchase Details
Closed on
Jul 22, 2019
Sold by
L & L Land Company Limited Partnership
Bought by
Mc Soule Enterprises Llc
Purchase Details
Closed on
Dec 17, 1999
Sold by
L & L Land Company
Bought by
L & L Land Company Limited Parnership
Create a Home Valuation Report for This Property
The Home Valuation Report is an in-depth analysis detailing your home's value as well as a comparison with similar homes in the area
Home Values in the Area
Average Home Value in this Area
Purchase History
| Date | Buyer | Sale Price | Title Company |
|---|---|---|---|
| Black River Properties Llc | -- | None Listed On Document | |
| Black River Properties Llc | -- | None Listed On Document | |
| Black River Properties Llc | -- | None Available | |
| Mc Soule Enterprises Llc | $155,000 | None Listed On Document | |
| L & L Land Company Limited Parnership | -- | None Available |
Source: Public Records
Property History
| Date | Event | Price | List to Sale | Price per Sq Ft |
|---|---|---|---|---|
| 08/07/2024 08/07/24 | For Rent | $975 | -- | -- |
Tax History Compared to Growth
Tax History
| Year | Tax Paid | Tax Assessment Tax Assessment Total Assessment is a certain percentage of the fair market value that is determined by local assessors to be the total taxable value of land and additions on the property. | Land | Improvement |
|---|---|---|---|---|
| 2025 | $6,326 | $144,500 | $0 | $0 |
| 2024 | $5,780 | $137,500 | $0 | $0 |
| 2023 | $5,473 | $117,300 | $0 | $0 |
| 2022 | $5,728 | $95,100 | $0 | $0 |
| 2021 | $5,467 | $87,900 | $0 | $0 |
| 2020 | $5,490 | $86,700 | $86,700 | $0 |
| 2019 | $5,402 | $84,700 | $0 | $0 |
| 2018 | $5,280 | $84,700 | $0 | $0 |
| 2017 | $4,842 | $81,700 | $0 | $0 |
| 2016 | $4,354 | $81,700 | $0 | $0 |
| 2015 | $4,324 | $80,600 | $80,600 | $0 |
| 2014 | $4,324 | $80,300 | $80,300 | $0 |
| 2013 | -- | $80,700 | $0 | $0 |
Source: Public Records
Map
Nearby Homes