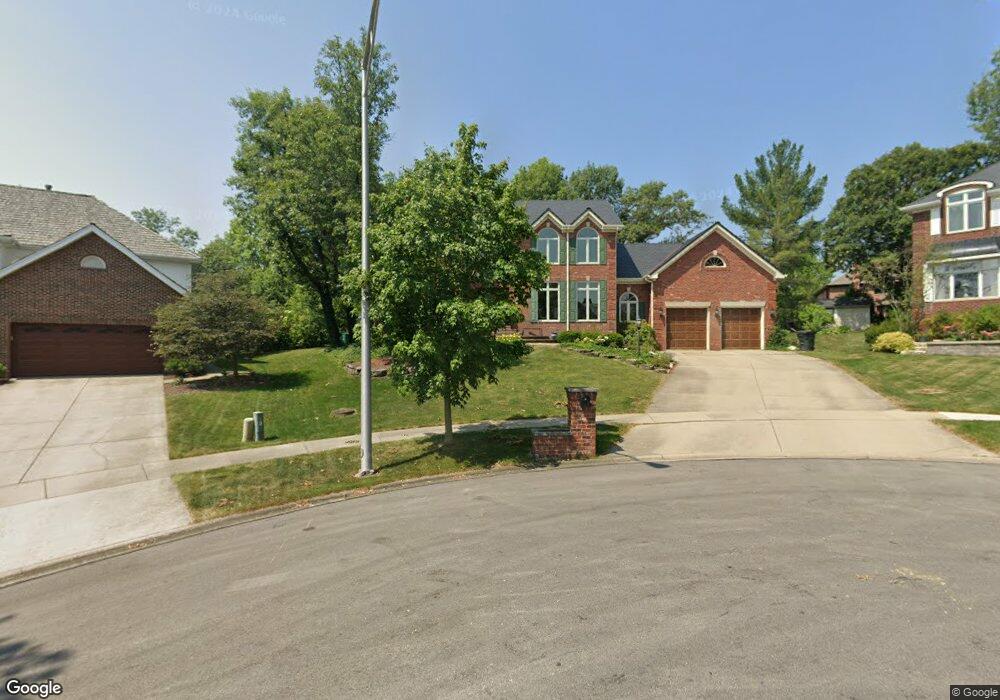
11331 Poplar Creek Ln Orland Park, IL 60467
Centennial NeighborhoodEstimated Value: $712,202 - $764,000
4
Beds
4
Baths
3,400
Sq Ft
$220/Sq Ft
Est. Value
About This Home
This home is located at 11331 Poplar Creek Ln, Orland Park, IL 60467 and is currently estimated at $746,401, approximately $219 per square foot. 11331 Poplar Creek Ln is a home located in Cook County with nearby schools including Centennial School, Meadow Ridge School, and Century Junior High School.
Ownership History
Date
Name
Owned For
Owner Type
Purchase Details
Closed on
Aug 18, 2025
Sold by
Cummings James M and Cummings Kathryn J
Bought by
James M Cummings And Kathryn J Cummings Revoc and Cummings
Current Estimated Value
Purchase Details
Closed on
Aug 13, 2010
Sold by
Kelly John J and Kelly Julie C
Bought by
Cummings James M and Cummings Kathryn J
Home Financials for this Owner
Home Financials are based on the most recent Mortgage that was taken out on this home.
Original Mortgage
$375,000
Interest Rate
4.6%
Mortgage Type
New Conventional
Purchase Details
Closed on
Jan 27, 2004
Sold by
Standard Bank & Trust Co
Bought by
Kelly John J and Kelly Julie C
Home Financials for this Owner
Home Financials are based on the most recent Mortgage that was taken out on this home.
Original Mortgage
$436,000
Interest Rate
5.25%
Mortgage Type
Unknown
Purchase Details
Closed on
Sep 1, 1994
Sold by
Macaluso Louis J and Macaluso Sharon M
Bought by
Standard Bank & Trust Company
Create a Home Valuation Report for This Property
The Home Valuation Report is an in-depth analysis detailing your home's value as well as a comparison with similar homes in the area
Home Values in the Area
Average Home Value in this Area
Purchase History
| Date | Buyer | Sale Price | Title Company |
|---|---|---|---|
| James M Cummings And Kathryn J Cummings Revoc | -- | Fidelity National Title | |
| Cummings James M | $525,000 | Fatic | |
| Kelly John J | $550,000 | -- | |
| Standard Bank & Trust Company | -- | -- |
Source: Public Records
Mortgage History
| Date | Status | Borrower | Loan Amount |
|---|---|---|---|
| Previous Owner | Cummings James M | $375,000 | |
| Previous Owner | Kelly John J | $436,000 |
Source: Public Records
Tax History Compared to Growth
Tax History
| Year | Tax Paid | Tax Assessment Tax Assessment Total Assessment is a certain percentage of the fair market value that is determined by local assessors to be the total taxable value of land and additions on the property. | Land | Improvement |
|---|---|---|---|---|
| 2024 | $13,435 | $57,000 | $6,184 | $50,816 |
| 2023 | $14,301 | $57,000 | $6,184 | $50,816 |
| 2022 | $14,301 | $51,163 | $8,246 | $42,917 |
| 2021 | $13,838 | $51,161 | $8,245 | $42,916 |
| 2020 | $14,906 | $56,632 | $8,245 | $48,387 |
| 2019 | $11,688 | $46,011 | $7,420 | $38,591 |
| 2018 | $11,366 | $46,011 | $7,420 | $38,591 |
| 2017 | $12,050 | $49,559 | $7,420 | $42,139 |
| 2016 | $11,319 | $43,061 | $6,596 | $36,465 |
| 2015 | $11,324 | $43,601 | $6,596 | $37,005 |
| 2014 | $11,171 | $43,601 | $6,596 | $37,005 |
| 2013 | $12,896 | $52,944 | $6,596 | $46,348 |
Source: Public Records
Map
Nearby Homes
- 11155 Lizmore Ln Unit 35B
- 80 Windmill Rd
- 11049 Lizmore Ln Unit 40B
- 15141 Arbor Dr
- 137 Singletree Rd
- 10855 W 153rd St
- 10924 Crystal Springs Ln
- 87 Windmill Rd
- 15501 116th Ct
- 15640 113th Ave
- 15610 116th Ave
- 15220 Arbor Dr
- 10908 Royal Glen Dr
- 15657 116th Ave
- 15801 115th Ave
- 11390 158th St
- 14700 108th Ave
- 15212 Penrose Ct
- 15106 Penrose Ct
- 15160 Penrose Ct
- 11321 Poplar Creek Ln
- 15117 Ginger Creek Ln
- 11330 Poplar Creek Ln
- 15125 Ginger Creek Ln
- 11332 Spring Creek Ln
- 15109 Ginger Creek Ln
- 11311 Poplar Creek Ln
- 11322 Spring Creek Ln
- 15133 Ginger Creek Ln
- 15165 Ginger Creek Ln
- 11320 Poplar Creek Ln
- 15149 Ginger Creek Ln
- 15101 Ginger Creek Ln
- 11301 Poplar Creek Ln
- 11310 Poplar Creek Ln
- 11300 Poplar Creek Ln
- 11312 Spring Creek Ln
- 15116 Ginger Creek Ln
- 15164 Ginger Creek Ln
- 15124 Ginger Creek Ln