11332 Saint Aubin St Unit Bldg-Unit HamtraMcK, MI 48212
Estimated Value: $125,000 - $186,000
--
Bed
2
Baths
885
Sq Ft
$173/Sq Ft
Est. Value
About This Home
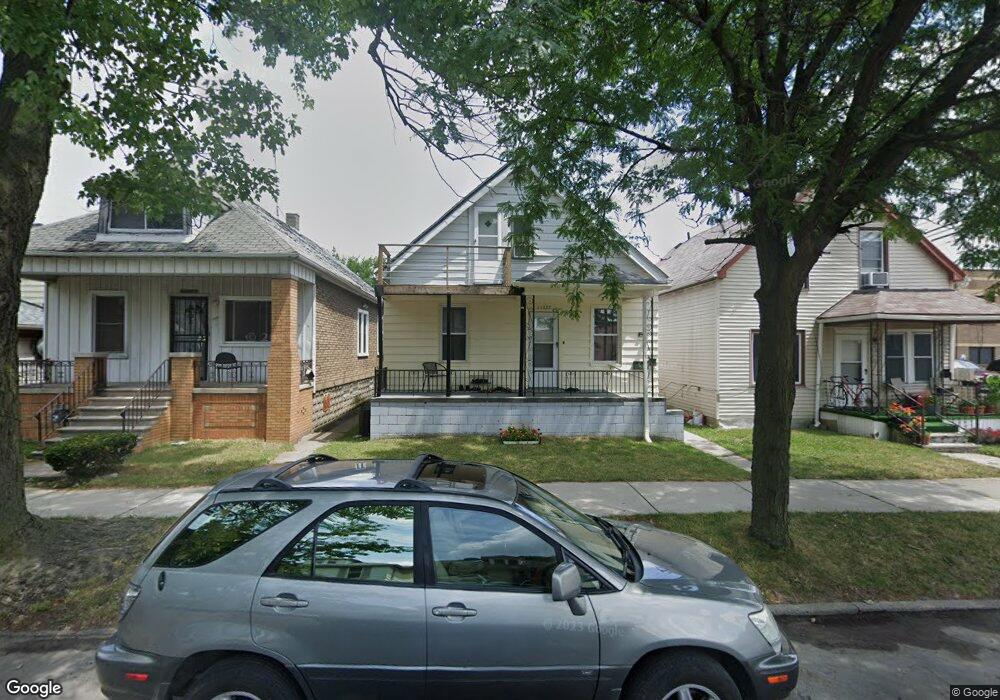
This home is located at 11332 Saint Aubin St Unit Bldg-Unit, HamtraMcK, MI 48212 and is currently estimated at $153,022, approximately $172 per square foot. 11332 Saint Aubin St Unit Bldg-Unit is a home located in Wayne County with nearby schools including Dickinson West Elementary School, Kosciuszko Middle School, and Hamtramck High School.
Ownership History
Date
Name
Owned For
Owner Type
Purchase Details
Closed on
Jan 10, 2024
Sold by
Alim Marzana
Bought by
Islam Rifatul
Current Estimated Value
Purchase Details
Closed on
Apr 5, 2010
Sold by
Miah Aftab and Begum Ismatara
Bought by
Alim Marzana
Purchase Details
Closed on
Dec 28, 2009
Sold by
Khan Wahidul Islam and Chowdhury Nasrin A
Bought by
Miah Aftab
Purchase Details
Closed on
Nov 16, 2009
Sold by
Wojtowicz Raymond J
Bought by
Khan Wahidul Islam
Purchase Details
Closed on
May 20, 2005
Sold by
Mortgage Electronic Registration Systems
Bought by
Jpmorgan Chase Bank
Purchase Details
Closed on
May 4, 2005
Sold by
Kidd Shawk and Kidd Michael
Bought by
Mortgage Electronic Registration Systems
Purchase Details
Closed on
Apr 7, 2005
Sold by
Corinthian Development Inc
Bought by
Kidd Shawn
Create a Home Valuation Report for This Property
The Home Valuation Report is an in-depth analysis detailing your home's value as well as a comparison with similar homes in the area
Home Values in the Area
Average Home Value in this Area
Purchase History
| Date | Buyer | Sale Price | Title Company |
|---|---|---|---|
| Islam Rifatul | $82,000 | None Listed On Document | |
| Alim Marzana | -- | None Available | |
| Miah Aftab | $3,000 | None Available | |
| Khan Wahidul Islam | $1,100 | None Available | |
| Jpmorgan Chase Bank | -- | -- | |
| Mortgage Electronic Registration Systems | $53,320 | -- | |
| Kidd Shawn | $8,949 | Multiple |
Source: Public Records
Tax History Compared to Growth
Tax History
| Year | Tax Paid | Tax Assessment Tax Assessment Total Assessment is a certain percentage of the fair market value that is determined by local assessors to be the total taxable value of land and additions on the property. | Land | Improvement |
|---|---|---|---|---|
| 2025 | $2,100 | $69,300 | $0 | $0 |
| 2024 | $2,100 | $58,400 | $0 | $0 |
| 2023 | $2,429 | $52,200 | $0 | $0 |
| 2022 | $2,080 | $42,800 | $0 | $0 |
| 2021 | $1,064 | $33,500 | $0 | $0 |
| 2020 | $1,596 | $28,400 | $0 | $0 |
| 2019 | $2,818 | $23,000 | $0 | $0 |
| 2018 | $912 | $20,300 | $0 | $0 |
| 2017 | $352 | $16,400 | $0 | $0 |
| 2016 | $1,058 | $14,600 | $0 | $0 |
| 2015 | $1,390 | $13,900 | $0 | $0 |
| 2013 | $1,420 | $14,200 | $0 | $0 |
| 2012 | $1,087 | $15,900 | $2,600 | $13,300 |
Source: Public Records
Map
Nearby Homes
- 11399 Lumpkin St
- 2029 Trowbridge St
- 2143 Trowbridge St
- 11524 Nagel St
- 2361 Caniff St
- 2112 Belmont St
- 11603 Lumpkin St
- 11609 Saint Aubin St
- 11614 Nagel St
- 2417 Casmere St
- 2343 Evaline St
- 9727 Dequindre St
- 12015 Lumpkin St
- 12051 Fleming St
- 1958 Norwalk St
- 2282 Norwalk St
- 2689 Edwin St
- 9845 Russell St
- 12133 Fleming St
- 9833 Russell St
- 11332 Saint Aubin St
- 11326 Saint Aubin St
- 11340 Saint Aubin St
- 11344 Saint Aubin St
- 11350 Saint Aubin St
- 11356 Saint Aubin St
- 11333 Lumpkin St
- 11323 Lumpkin St Unit Bldg-Unit
- 11323 Lumpkin St
- 11323 Lumpkin St
- 11339 Lumpkin St
- 11345 Lumpkin St
- 11362 Saint Aubin St
- 11351 Lumpkin St
- 11331 Saint Aubin St
- 11327 Saint Aubin St
- 11339 Saint Aubin St
- 11357 Lumpkin St
- 11368 Saint Aubin St
- 11345 Saint Aubin St