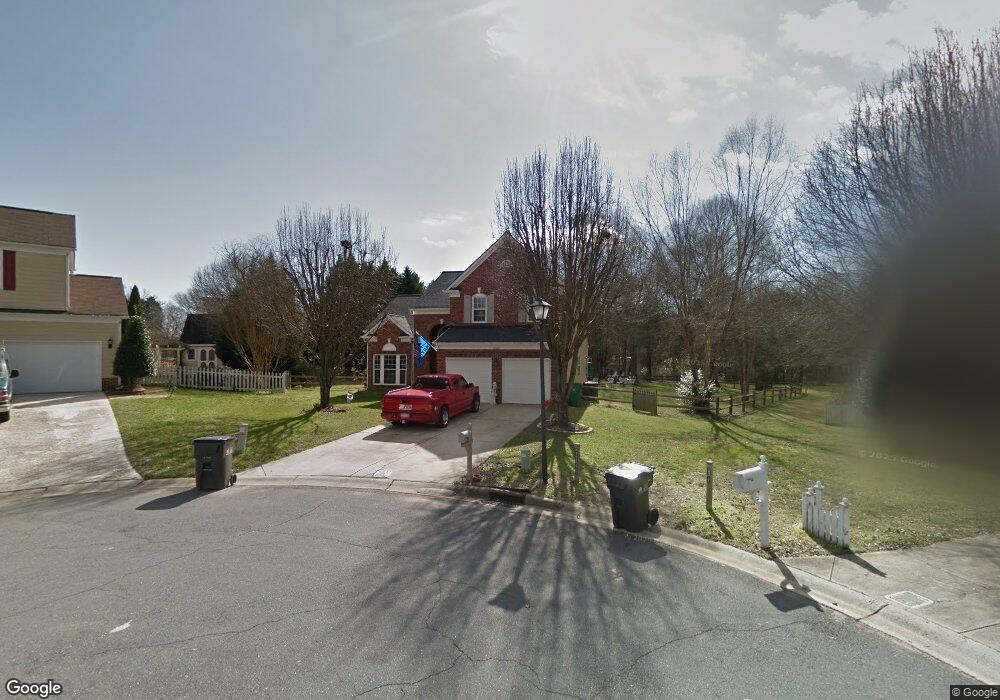
11335 Livingston Mill Rd Charlotte, NC 28273
Yorkshire NeighborhoodEstimated Value: $413,000 - $435,000
3
Beds
3
Baths
2,075
Sq Ft
$205/Sq Ft
Est. Value
About This Home
This home is located at 11335 Livingston Mill Rd, Charlotte, NC 28273 and is currently estimated at $424,753, approximately $204 per square foot. 11335 Livingston Mill Rd is a home located in Mecklenburg County with nearby schools including River Gate Elementary, Southwest Middle School, and Unity Classical Charter School.
Ownership History
Date
Name
Owned For
Owner Type
Purchase Details
Closed on
Feb 28, 2022
Sold by
Ann Sanders Sara
Bought by
Bird Daryll V and Bird Kimberly
Current Estimated Value
Home Financials for this Owner
Home Financials are based on the most recent Mortgage that was taken out on this home.
Original Mortgage
$344,350
Outstanding Balance
$325,402
Interest Rate
5%
Mortgage Type
New Conventional
Estimated Equity
$99,351
Purchase Details
Closed on
Feb 14, 2014
Sold by
John David R and John Janna S
Bought by
Sanders William E and Sanders Barbara C
Purchase Details
Closed on
Jan 9, 2005
Sold by
Gussman Phillip John and Gussman Joy Partin
Bought by
John David R and John Janna S
Home Financials for this Owner
Home Financials are based on the most recent Mortgage that was taken out on this home.
Original Mortgage
$130,000
Interest Rate
6.19%
Mortgage Type
Fannie Mae Freddie Mac
Create a Home Valuation Report for This Property
The Home Valuation Report is an in-depth analysis detailing your home's value as well as a comparison with similar homes in the area
Home Values in the Area
Average Home Value in this Area
Purchase History
| Date | Buyer | Sale Price | Title Company |
|---|---|---|---|
| Bird Daryll V | $355,000 | Welton Law Llc | |
| Sanders William E | $180,000 | Investors Title Ins Co | |
| John David R | $173,500 | Investors |
Source: Public Records
Mortgage History
| Date | Status | Borrower | Loan Amount |
|---|---|---|---|
| Open | Bird Daryll V | $344,350 | |
| Previous Owner | John David R | $130,000 |
Source: Public Records
Tax History Compared to Growth
Tax History
| Year | Tax Paid | Tax Assessment Tax Assessment Total Assessment is a certain percentage of the fair market value that is determined by local assessors to be the total taxable value of land and additions on the property. | Land | Improvement |
|---|---|---|---|---|
| 2025 | $2,992 | $374,900 | $94,500 | $280,400 |
| 2024 | $2,992 | $374,900 | $94,500 | $280,400 |
| 2023 | $2,889 | $374,900 | $94,500 | $280,400 |
| 2022 | $2,420 | $237,800 | $57,800 | $180,000 |
| 2021 | $2,295 | $237,800 | $57,800 | $180,000 |
| 2020 | $2,295 | $237,800 | $57,800 | $180,000 |
| 2019 | $1,239 | $237,800 | $57,800 | $180,000 |
| 2018 | $1,160 | $165,700 | $35,000 | $130,700 |
| 2017 | $2,208 | $165,700 | $35,000 | $130,700 |
| 2016 | $2,198 | $165,700 | $35,000 | $130,700 |
| 2015 | $2,187 | $165,700 | $35,000 | $130,700 |
| 2014 | $2,190 | $165,700 | $35,000 | $130,700 |
Source: Public Records
Map
Nearby Homes
- 11320 Wagonford Ln
- 11314 Bumpious Ct
- 13443 Kibworth Ln
- 13506 Stephendale Dr
- 12408 Savannah Cottage Dr
- 13651 Capworth Ln
- 13116 Erwin Rd
- 14755 Lions Paw St
- 14606 Vaughan Dr
- 14640 Lions Paw St
- 14021 Harlequin Dr
- 14725 Vaughan Dr
- 15005 Savannah Hall Dr Unit Lot 72
- 13617 Merton Woods Ln
- 13332 Savannah Club Dr
- 13308 Bolingbrook Ln
- 11521 Savannah Creek Dr
- 13310 Erwin Rd
- 11548 Savannah Creek Dr
- 14722 Lions Pride Ct
- 11333 Livingston Mill Rd
- 13830 Queenswater Ln
- 11336 Livingston Mill Rd
- 13826 Queenswater Ln
- 11329 Livingston Mill Rd
- 11334 Livingston Mill Rd
- 13816 Queenswater Ln
- 11325 Livingston Mill Rd
- 13810 Queenswater Ln
- 13700 Moss Rd
- 13831 Queenswater Ln
- 13506 Misty Dew Ct
- 11319 Livingston Mill Rd
- 13823 Queenswater Ln
- 13806 Queenswater Ln
- 13827 Queenswater Ln
- 11324 Livingston Mill Rd
- 13510 Misty Dew Ct
- 13817 Queenswater Ln
- 13514 Misty Dew Ct