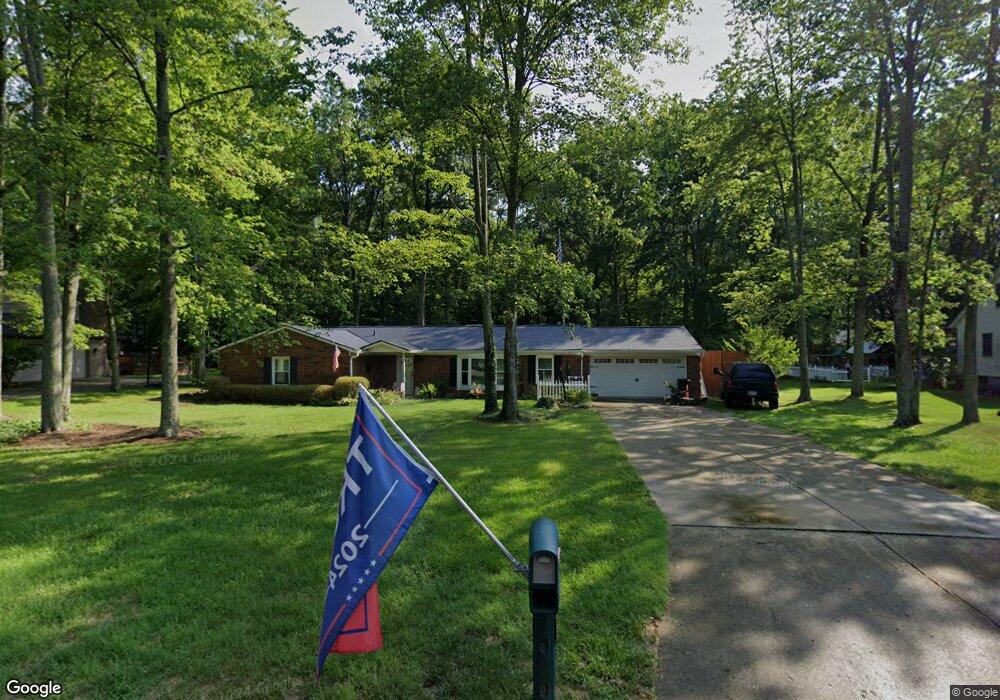
1134 Deerhaven Ct Loveland, OH 45140
Outer Loveland NeighborhoodEstimated Value: $266,000 - $366,000
3
Beds
2
Baths
1,734
Sq Ft
$188/Sq Ft
Est. Value
About This Home
This home is located at 1134 Deerhaven Ct, Loveland, OH 45140 and is currently estimated at $325,910, approximately $187 per square foot. 1134 Deerhaven Ct is a home located in Clermont County with nearby schools including Milford Senior High School, Milford Christian Academy, and St. Andrew - St. Elizabeth Ann Seton School.
Ownership History
Date
Name
Owned For
Owner Type
Purchase Details
Closed on
May 27, 2022
Sold by
James Paul S
Bought by
Powell David E
Current Estimated Value
Purchase Details
Closed on
Feb 18, 2008
Sold by
Geiser Helmut and Geiser Rebecca K
Bought by
James Paul S
Home Financials for this Owner
Home Financials are based on the most recent Mortgage that was taken out on this home.
Original Mortgage
$147,600
Interest Rate
5.9%
Mortgage Type
Purchase Money Mortgage
Purchase Details
Closed on
Jun 19, 2000
Sold by
Dunham Bruce E
Bought by
Geiser Helmut and Geiser Rebecca K
Purchase Details
Closed on
Oct 25, 1995
Sold by
Renner Catherine E
Bought by
Dunham Bruce E and Mcdow Kelly
Home Financials for this Owner
Home Financials are based on the most recent Mortgage that was taken out on this home.
Original Mortgage
$117,300
Interest Rate
7.5%
Mortgage Type
New Conventional
Purchase Details
Closed on
Jul 12, 1990
Purchase Details
Closed on
Apr 1, 1989
Purchase Details
Closed on
Nov 1, 1986
Create a Home Valuation Report for This Property
The Home Valuation Report is an in-depth analysis detailing your home's value as well as a comparison with similar homes in the area
Home Values in the Area
Average Home Value in this Area
Purchase History
| Date | Buyer | Sale Price | Title Company |
|---|---|---|---|
| Powell David E | $225,000 | Mattingly Ford Title | |
| James Paul S | $164,000 | Attorney | |
| Geiser Helmut | $138,000 | -- | |
| Dunham Bruce E | $123,500 | -- | |
| -- | $95,000 | -- | |
| -- | $91,000 | -- | |
| -- | $77,300 | -- |
Source: Public Records
Mortgage History
| Date | Status | Borrower | Loan Amount |
|---|---|---|---|
| Previous Owner | James Paul S | $147,600 | |
| Previous Owner | Dunham Bruce E | $117,300 | |
| Closed | Geiser Helmut | -- |
Source: Public Records
Tax History Compared to Growth
Tax History
| Year | Tax Paid | Tax Assessment Tax Assessment Total Assessment is a certain percentage of the fair market value that is determined by local assessors to be the total taxable value of land and additions on the property. | Land | Improvement |
|---|---|---|---|---|
| 2024 | $3,653 | $78,760 | $19,430 | $59,330 |
| 2023 | $3,690 | $78,760 | $19,430 | $59,330 |
| 2022 | $4,778 | $78,120 | $14,700 | $63,420 |
| 2021 | $4,781 | $78,120 | $14,700 | $63,420 |
| 2020 | $4,585 | $78,120 | $14,700 | $63,420 |
| 2019 | $4,122 | $66,510 | $12,990 | $53,520 |
| 2018 | $4,123 | $66,510 | $12,990 | $53,520 |
| 2017 | $3,856 | $66,510 | $12,990 | $53,520 |
| 2016 | $3,920 | $57,330 | $11,200 | $46,130 |
| 2015 | $3,598 | $57,330 | $11,200 | $46,130 |
| 2014 | $3,598 | $57,330 | $11,200 | $46,130 |
| 2013 | $3,029 | $46,800 | $12,250 | $34,550 |
Source: Public Records
Map
Nearby Homes
- 6211 Spires Dr
- 1803 Wheatfield Way
- 6149 Century Farm Dr
- 2013 Weber Rd
- 6320 Ashford Dr
- 6141 Brandywine Ct
- 1140 Weber Rd
- 6108 Donna Jay Dr
- 1064 Weber Rd
- 1124 Clover Field Dr
- 6077 Branch Hill Guinea Pike
- 1113 Clover Field Dr
- 5933 Firm Stance Dr
- 6211 Cook Rd
- 1285 State Rte 28
- 1376 Barre Ln
- 1513 Charleston Ln
- 6395 Barre Rd
- 1289 Woodville Pike
- 6379 Derbyshire Ln
- 1132 Deerhaven Ct
- 1136 Deerhaven Ct
- 1130 Deerhaven Ct
- 1125 Deerhaven Ct
- 1123 Deerhaven Ct
- 1127 Deerhaven Ct
- 1121 Deerhaven Ct
- 6234 Deerhaven Ln
- 1128 Deerhaven Ct
- 6113 Doe Ct
- 6236 Deerhaven Ln
- 1126 Deerhaven Ct
- 1137 Deerhaven Ct
- 1124 Deerhaven Ct
- 6122 Doe Ct
- 6115 Doe Ct
- 1122 Deerhaven Ct
- 6238 Deerhaven Ln
- 6233 Deerhaven Ln
- 1120 Deerhaven Ct