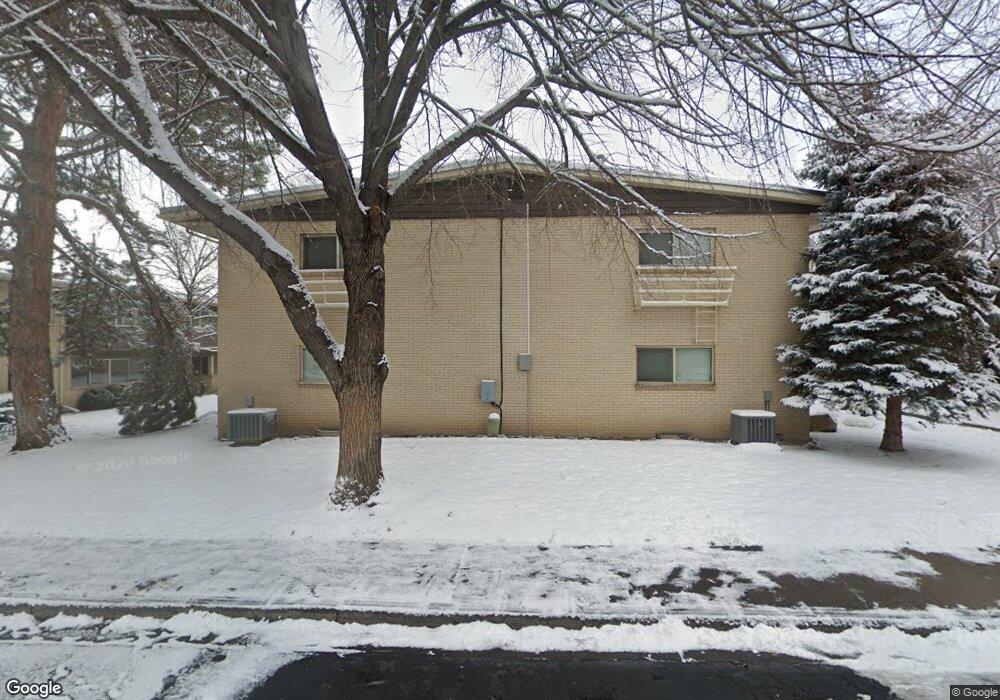
1134 E 2700 S Unit D25 Salt Lake City, UT 84106
Sugar House NeighborhoodEstimated Value: $355,000 - $374,701
2
Beds
1
Bath
1,278
Sq Ft
$287/Sq Ft
Est. Value
About This Home
This home is located at 1134 E 2700 S Unit D25, Salt Lake City, UT 84106 and is currently estimated at $366,175, approximately $286 per square foot. 1134 E 2700 S Unit D25 is a home located in Salt Lake County with nearby schools including Nibley Park School, Highland High School, and Carden Memorial School.
Ownership History
Date
Name
Owned For
Owner Type
Purchase Details
Closed on
May 5, 2021
Sold by
Wetsel Kori A
Bought by
Booth Forrest and Booth Louise H
Current Estimated Value
Purchase Details
Closed on
Jan 6, 2015
Sold by
The Pollyanna Apartments Llc
Bought by
Wetsel Kori A
Home Financials for this Owner
Home Financials are based on the most recent Mortgage that was taken out on this home.
Original Mortgage
$100,000
Interest Rate
3.87%
Mortgage Type
New Conventional
Purchase Details
Closed on
Apr 14, 2004
Sold by
The Pollyanna Apartments Lp
Bought by
The Pollyanna Apartments Llc
Purchase Details
Closed on
Dec 15, 1994
Sold by
Call Kathleen L
Bought by
Pollyana Apartments Ltd Partnership
Purchase Details
Closed on
Nov 4, 1993
Sold by
Hatch Arlene and Gregory D Company
Bought by
Call Kathleen L
Create a Home Valuation Report for This Property
The Home Valuation Report is an in-depth analysis detailing your home's value as well as a comparison with similar homes in the area
Home Values in the Area
Average Home Value in this Area
Purchase History
| Date | Buyer | Sale Price | Title Company |
|---|---|---|---|
| Booth Forrest | -- | Cottonwood Title | |
| Wetsel Kori A | -- | Keystone Title Ins Agcy Llc | |
| The Pollyanna Apartments Llc | -- | None Available | |
| Pollyana Apartments Ltd Partnership | -- | -- | |
| Pollyana Apartments Ltd Partnership | -- | -- | |
| Call Kathleen L | -- | -- |
Source: Public Records
Mortgage History
| Date | Status | Borrower | Loan Amount |
|---|---|---|---|
| Previous Owner | Wetsel Kori A | $100,000 |
Source: Public Records
Tax History Compared to Growth
Tax History
| Year | Tax Paid | Tax Assessment Tax Assessment Total Assessment is a certain percentage of the fair market value that is determined by local assessors to be the total taxable value of land and additions on the property. | Land | Improvement |
|---|---|---|---|---|
| 2025 | $1,848 | $319,500 | $95,800 | $223,700 |
| 2024 | $1,848 | $352,700 | $105,800 | $246,900 |
| 2023 | $1,791 | $329,400 | $98,800 | $230,600 |
| 2022 | $1,958 | $337,800 | $101,300 | $236,500 |
| 2021 | $1,345 | $210,200 | $63,000 | $147,200 |
| 2020 | $1,260 | $187,400 | $56,200 | $131,200 |
| 2019 | $1,406 | $196,700 | $59,000 | $137,700 |
| 2018 | $1,309 | $178,300 | $53,500 | $124,800 |
| 2017 | $1,244 | $0 | $0 | $0 |
| 2016 | $1,026 | $124,300 | $37,300 | $87,000 |
| 2015 | $1,030 | $118,300 | $35,500 | $82,800 |
| 2014 | $1,028 | $117,100 | $35,100 | $82,000 |
Source: Public Records
Map
Nearby Homes
- 1150 E 2700 S Unit G51
- 1150 E 2700 S Unit 50G
- 1152 E 2700 S Unit S148
- 1130 E 2700 S Unit K83
- 1192 E 2700 S
- 2710 S Highland Dr Unit 11
- 2594 S Elizabeth St
- 2760 S Highland Dr Unit 21
- 2760 S Highland Dr Unit 20
- 2584 S Elizabeth St Unit 5
- 2970 S Richmond St
- 1278 E Hudson Ave
- 1314 E Crandall Ave
- 2937 S 900 E
- 2865 S 1335 E
- 1978 S Windsor Cir
- 829 E 2700 S
- 876 Forest Park Ct
- 2438 S Elizabeth St Unit 2
- 2430 S Elizabeth St Unit 5
- 1134 E 2700 S Unit D27
- 1134 E 2700 S Unit D32
- 1134 E 2700 S Unit D28
- 1134 E 2700 S Unit D31
- 1134 E 2700 S Unit D26
- 1134 E 2700 S Unit D30
- 1134 E 2700 S Unit D29
- 1134 E 2700 S
- 1160 E 2700 S Unit Q133
- 1160 E 2700 S Unit Q129
- 1160 E 2700 S Unit Q136
- 1160 E 2700 S Unit Q135
- 1160 E 2700 S Unit Q132
- 1160 E 2700 S Unit Q134
- 1160 E 2700 S Unit Q131
- 1160 E 2700 S Unit Q130
- 1138 E 2700 S Unit F43
- 1138 E 2700 S Unit F41
- 1138 E 2700 S Unit F48
- 1138 E 2700 S Unit F44