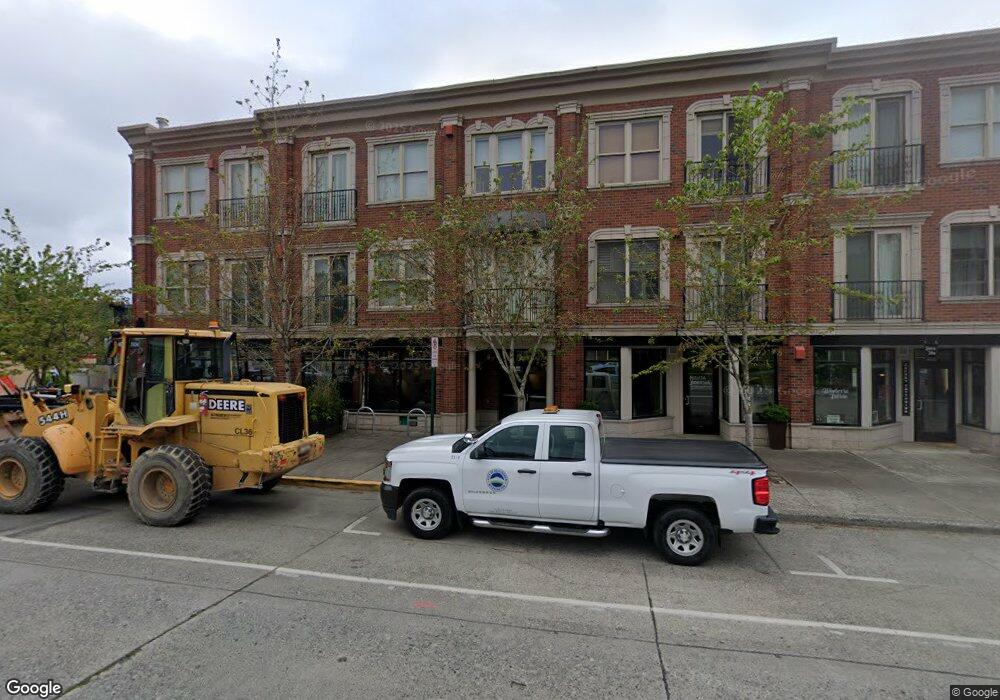
1134 Finnegan Way Unit 501 Bellingham, WA 98225
Fairhaven NeighborhoodEstimated Value: $1,323,000 - $1,617,000
3
Beds
2
Baths
1,934
Sq Ft
$779/Sq Ft
Est. Value
About This Home
This home is located at 1134 Finnegan Way Unit 501, Bellingham, WA 98225 and is currently estimated at $1,505,918, approximately $778 per square foot. 1134 Finnegan Way Unit 501 is a home located in Whatcom County with nearby schools including Lowell Elementary School, Fairhaven Middle School, and Sehome High School.
Ownership History
Date
Name
Owned For
Owner Type
Purchase Details
Closed on
Jan 6, 2021
Sold by
Skow-Turk Family Trust and Turk Trina Michelle
Bought by
Skow-Turk Gst Exempt Qtip Credit Shelter Trus and Turk
Current Estimated Value
Purchase Details
Closed on
Sep 3, 2009
Sold by
Skow Jonathan and Turk Trina
Bought by
Skow Jonathan Douglas and Turk Trina Michelle
Purchase Details
Closed on
Sep 22, 2008
Sold by
Kelly Richard B and Kelly Loretta M
Bought by
Skow Jonathan and Turk Trina
Home Financials for this Owner
Home Financials are based on the most recent Mortgage that was taken out on this home.
Original Mortgage
$600,000
Interest Rate
5.75%
Mortgage Type
Purchase Money Mortgage
Purchase Details
Closed on
Nov 21, 2005
Sold by
Fairhaven Gardens Llc
Bought by
Kelly Richard B and Kelly Loretta M
Create a Home Valuation Report for This Property
The Home Valuation Report is an in-depth analysis detailing your home's value as well as a comparison with similar homes in the area
Home Values in the Area
Average Home Value in this Area
Purchase History
| Date | Buyer | Sale Price | Title Company |
|---|---|---|---|
| Skow-Turk Gst Exempt Qtip Credit Shelter Trus | -- | None Listed On Document | |
| Turk Trina Michelle | -- | None Available | |
| Skow Jonathan Douglas | -- | None Available | |
| Skow Jonathan | $942,780 | Chicago Title Insurance | |
| Kelly Richard B | $763,414 | Chicago Title Insurance |
Source: Public Records
Mortgage History
| Date | Status | Borrower | Loan Amount |
|---|---|---|---|
| Previous Owner | Skow Jonathan | $600,000 |
Source: Public Records
Tax History Compared to Growth
Tax History
| Year | Tax Paid | Tax Assessment Tax Assessment Total Assessment is a certain percentage of the fair market value that is determined by local assessors to be the total taxable value of land and additions on the property. | Land | Improvement |
|---|---|---|---|---|
| 2024 | $13,394 | $1,722,086 | $84,665 | $1,637,421 |
| 2023 | $13,394 | $1,722,086 | $84,665 | $1,637,421 |
| 2022 | $11,846 | $1,497,431 | $73,620 | $1,423,811 |
| 2021 | $11,156 | $1,269,013 | $62,390 | $1,206,623 |
| 2020 | $10,643 | $1,103,445 | $54,250 | $1,049,195 |
| 2019 | $10,055 | $1,017,000 | $50,000 | $967,000 |
| 2018 | $10,561 | $963,483 | $45,507 | $917,976 |
| 2017 | $9,623 | $868,675 | $41,020 | $827,655 |
| 2016 | $8,899 | $826,225 | $39,970 | $786,255 |
| 2015 | $8,377 | $796,015 | $38,395 | $757,620 |
| 2014 | -- | $725,000 | $35,000 | $690,000 |
| 2013 | -- | $725,000 | $35,000 | $690,000 |
Source: Public Records
Map
Nearby Homes
- 1201 13th St Unit 301
- 1101 Mckenzie Ave Unit 206
- 1315 Mill Ave
- 910 Harris Ave Unit 208
- 1014 11th St Unit 302
- 1211 14th St
- 929 11th St Unit 202
- 1302 Larrabee Ave
- 917 13th St
- 1005 15th St
- 1131 16th St
- 925 15th St
- 805 11th St
- 214 Bayside Place
- 600 S State St Unit 208
- 600 S State St Unit 212
- 600 S State St Unit 101
- 600 S State St Unit 204
- 1027 21st St
- 331 Chuckanut Dr N
- 1134 Finnegan Way
- 1134 Finnegan Way
- 1134 Finnegan Way Unit 301
- 1134 Finnegan Way Unit 405
- 1134 Finnegan Way Unit 308
- 1134 Finnegan Way Unit 303
- 1134 Finnegan Way Unit 203
- 1134 Finnegan Way Unit 503
- 1134 Finnegan Way Unit 407
- 1134 Finnegan Way Unit 406
- 1134 Finnegan Way Unit 403
- 1134 Finnegan Way Unit 401
- 1134 Finnegan Way Unit 307
- 1134 Finnegan Way Unit 306
- 1134 Finnegan Way Unit 305
- 1134 Finnegan Way Unit 304
- 1134 Finnegan Way Unit 302
- 1134 Finnegan Way Unit 301
- 1134 Finnegan Way Unit 202
- 1134 Finnegan Way Unit 201