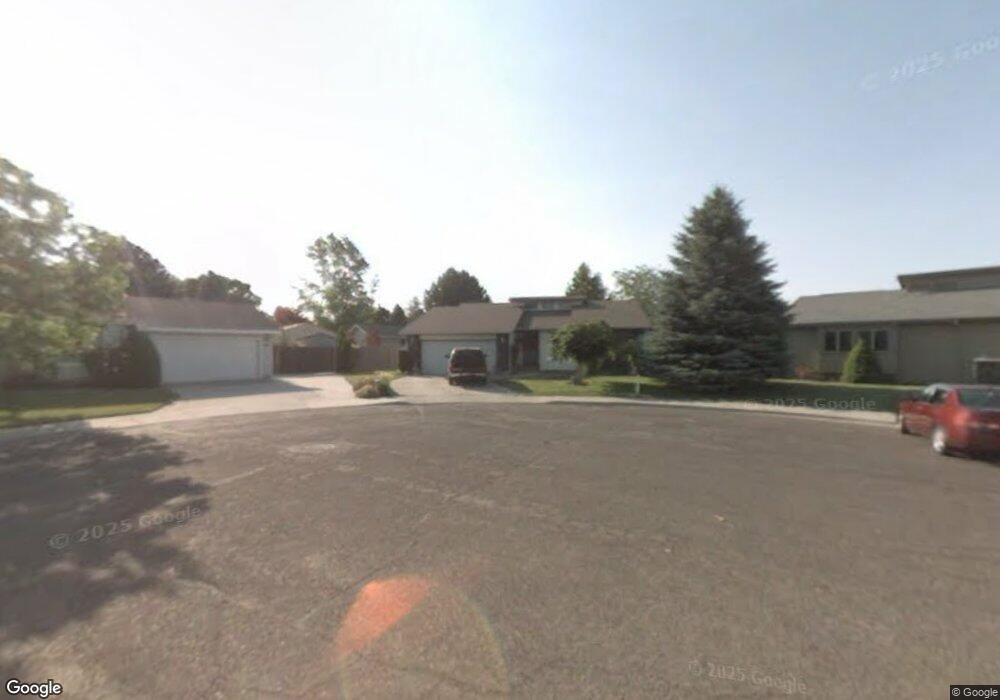
1134 Monaco St Twin Falls, ID 83301
Estimated Value: $338,000 - $376,000
3
Beds
2
Baths
1,619
Sq Ft
$223/Sq Ft
Est. Value
About This Home
This home is located at 1134 Monaco St, Twin Falls, ID 83301 and is currently estimated at $360,620, approximately $222 per square foot. 1134 Monaco St is a home located in Twin Falls County with nearby schools including I.B. Perrine Elementary School, Robert Stuart Junior High School, and Canyon Ridge High School.
Ownership History
Date
Name
Owned For
Owner Type
Purchase Details
Closed on
Jan 26, 2021
Sold by
Bragg Wallace H
Bought by
Bragg Nancy D
Current Estimated Value
Purchase Details
Closed on
Feb 15, 2013
Sold by
Bragg Nancy D
Bought by
Bragg Ii Wallace A
Home Financials for this Owner
Home Financials are based on the most recent Mortgage that was taken out on this home.
Original Mortgage
$75,600
Outstanding Balance
$14,396
Interest Rate
3.36%
Mortgage Type
New Conventional
Estimated Equity
$346,224
Purchase Details
Closed on
Feb 13, 2013
Sold by
Black Lana C
Bought by
Bragg Ii Wallace A
Home Financials for this Owner
Home Financials are based on the most recent Mortgage that was taken out on this home.
Original Mortgage
$75,600
Outstanding Balance
$14,396
Interest Rate
3.36%
Mortgage Type
New Conventional
Estimated Equity
$346,224
Purchase Details
Closed on
Oct 21, 2005
Sold by
Bragg Wallace A
Bought by
Bragg Lois
Create a Home Valuation Report for This Property
The Home Valuation Report is an in-depth analysis detailing your home's value as well as a comparison with similar homes in the area
Home Values in the Area
Average Home Value in this Area
Purchase History
| Date | Buyer | Sale Price | Title Company |
|---|---|---|---|
| Bragg Nancy D | -- | None Available | |
| Bragg Ii Wallace A | -- | Alliance Title | |
| Bragg Ii Wallace A | -- | Alliance Title | |
| Bragg Lois | -- | -- |
Source: Public Records
Mortgage History
| Date | Status | Borrower | Loan Amount |
|---|---|---|---|
| Open | Bragg Ii Wallace A | $75,600 |
Source: Public Records
Tax History Compared to Growth
Tax History
| Year | Tax Paid | Tax Assessment Tax Assessment Total Assessment is a certain percentage of the fair market value that is determined by local assessors to be the total taxable value of land and additions on the property. | Land | Improvement |
|---|---|---|---|---|
| 2025 | $1,828 | $315,350 | $79,580 | $235,770 |
| 2024 | $1,828 | $318,540 | $79,580 | $238,960 |
| 2023 | $1,705 | $331,280 | $79,580 | $251,700 |
| 2022 | $2,218 | $318,724 | $57,248 | $261,476 |
| 2021 | $1,862 | $247,368 | $53,440 | $193,928 |
| 2020 | $1,658 | $208,682 | $53,440 | $155,242 |
| 2019 | $1,741 | $194,884 | $44,803 | $150,081 |
| 2018 | $1,688 | $178,694 | $33,962 | $144,732 |
| 2017 | $1,493 | $159,275 | $33,962 | $125,313 |
| 2016 | $1,423 | $141,955 | $0 | $0 |
| 2015 | $1,384 | $141,955 | $33,962 | $107,993 |
| 2012 | -- | $144,451 | $0 | $0 |
Source: Public Records
Map
Nearby Homes
- 1148 Blake St N
- 1230 Blake St N
- 1039 Blake St N
- 329 Falls Ave W
- 167 Robbins Ave
- 145 Robbins Ave
- 145, 147, 149 Robbins St
- 797-3-1 Meadows Dr
- 147 Robbins Ave
- 833 Monroe St
- 149 Robbins Ave
- 790 Academic Dr
- 748 Meadows Dr
- 1434 Tara St
- 551 Park Meadows Cir
- 356 Monroe Cir
- 1108 Twin Parks Dr
- 281 Caswell Ave W Unit A-10
- 874 Eastwind Dr
- 1494 Northern Pine Dr
- 1135 Imperial St
- 1141 Imperial St
- 1140 Monaco St
- 1130 Monaco St
- 1143 Imperial St
- 1122 Monaco St
- 1121 & 112 Imperial
- 1121 & 1123 Imperial St
- 1151 Imperial St
- 1146 Monaco St
- 1121 Imperial St
- 158 Ridgeway Dr
- 158 & 162 Ridgeway
- 1135 Monaco St
- 1153 Imperial St
- 1112 Monaco St
- 1111 Imperial St
- 1156 Monaco St
- 1130 Imperial St
- 1143 Monaco St