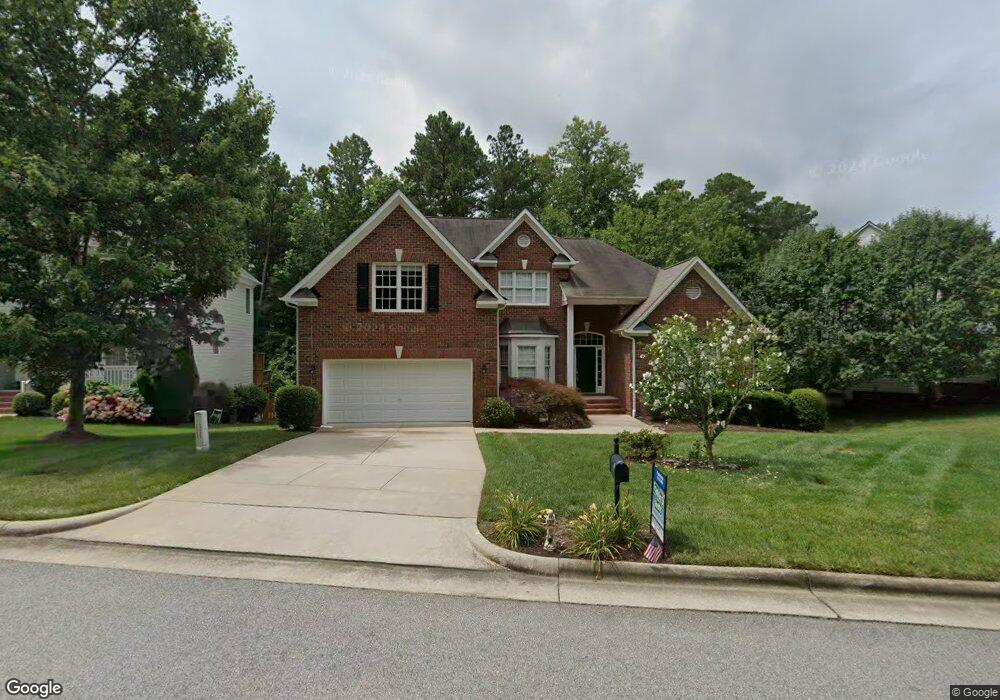
1134 Scholastic Cir Durham, NC 27713
South Durham NeighborhoodEstimated Value: $614,000 - $741,000
4
Beds
4
Baths
3,085
Sq Ft
$225/Sq Ft
Est. Value
About This Home
This home is located at 1134 Scholastic Cir, Durham, NC 27713 and is currently estimated at $694,348, approximately $225 per square foot. 1134 Scholastic Cir is a home located in Durham County with nearby schools including Lowe's Grove Middle, Hillside High School, and Southpoint Academy.
Ownership History
Date
Name
Owned For
Owner Type
Purchase Details
Closed on
Jul 25, 2019
Sold by
Radabaugh Janece C
Bought by
Gonzalez Jason and Gonzalez Ashley
Current Estimated Value
Home Financials for this Owner
Home Financials are based on the most recent Mortgage that was taken out on this home.
Original Mortgage
$345,600
Interest Rate
3.7%
Mortgage Type
New Conventional
Purchase Details
Closed on
Jul 8, 2005
Sold by
Lew Evan M and Lew Jane Ling
Bought by
Radabaugh Phillip E and Radabaugh Janece C
Home Financials for this Owner
Home Financials are based on the most recent Mortgage that was taken out on this home.
Original Mortgage
$250,000
Interest Rate
5.54%
Mortgage Type
Fannie Mae Freddie Mac
Purchase Details
Closed on
Dec 15, 2003
Sold by
Galloway Homes Llc
Bought by
Lew Evan M and Lew Jane L
Home Financials for this Owner
Home Financials are based on the most recent Mortgage that was taken out on this home.
Original Mortgage
$220,638
Interest Rate
5.87%
Mortgage Type
Purchase Money Mortgage
Create a Home Valuation Report for This Property
The Home Valuation Report is an in-depth analysis detailing your home's value as well as a comparison with similar homes in the area
Home Values in the Area
Average Home Value in this Area
Purchase History
| Date | Buyer | Sale Price | Title Company |
|---|---|---|---|
| Gonzalez Jason | $432,000 | None Available | |
| Radabaugh Phillip E | $375,000 | -- | |
| Lew Evan M | $331,000 | -- |
Source: Public Records
Mortgage History
| Date | Status | Borrower | Loan Amount |
|---|---|---|---|
| Previous Owner | Gonzalez Jason | $345,600 | |
| Previous Owner | Radabaugh Phillip E | $250,000 | |
| Previous Owner | Lew Evan M | $220,638 |
Source: Public Records
Tax History
| Year | Tax Paid | Tax Assessment Tax Assessment Total Assessment is a certain percentage of the fair market value that is determined by local assessors to be the total taxable value of land and additions on the property. | Land | Improvement |
|---|---|---|---|---|
| 2025 | $6,591 | $664,876 | $178,125 | $486,751 |
| 2024 | $5,620 | $402,918 | $78,375 | $324,543 |
| 2023 | $5,278 | $402,918 | $78,375 | $324,543 |
| 2022 | $5,157 | $402,918 | $78,375 | $324,543 |
| 2021 | $5,133 | $402,918 | $78,375 | $324,543 |
| 2020 | $5,012 | $402,918 | $78,375 | $324,543 |
| 2019 | $5,012 | $402,918 | $78,375 | $324,543 |
| 2018 | $4,390 | $323,598 | $53,295 | $270,303 |
| 2017 | $4,357 | $323,598 | $53,295 | $270,303 |
| 2016 | $4,210 | $323,598 | $53,295 | $270,303 |
| 2015 | $4,605 | $332,672 | $60,467 | $272,205 |
| 2014 | $4,605 | $332,672 | $60,467 | $272,205 |
Source: Public Records
Map
Nearby Homes
- 1104 Scholastic Cir
- 1355 Southpoint Trail
- 1604 Timber Wolf Dr
- 1416 Southpoint Trail
- 102 College Ave
- 7907 Massey Chapel Rd
- 7502 Hedfield Way
- 204 S Bend Dr
- 102 Higher Learning Dr
- 408 Intern Way
- 822 Watercolor Way
- 8008 Crenshaw Ln
- 819 Watercolor Way
- 946 Watercolor Way
- 1406 Excelsior Grand Ave
- 8115 Massey Chapel Rd
- 1008 Whistler St
- 139 Callowhill Ln
- 1448 Cherob Ln
- 1416 Newpoint Dr
- 1136 Scholastic Cir
- 1130 Scholastic Cir
- 1138 Scholastic Cir
- 1128 Scholastic Cir
- 1127 Scholastic Cir
- 1125 Scholastic Cir
- 1140 Scholastic Cir
- 5 Curriculum Ct
- 1145 Scholastic Cir
- 1121 Scholastic Cir
- 1126 Scholastic Cir
- 3 Curriculum Ct
- 1117 Scholastic Cir
- 4 Curriculum Ct
- 1147 Scholastic Cir
- 1144 Scholastic Cir
- 1115 Scholastic Cir
- 1124 Scholastic Cir
- 1001 Scholastic Cir
- 1146 Scholastic Cir
Your Personal Tour Guide
Ask me questions while you tour the home.