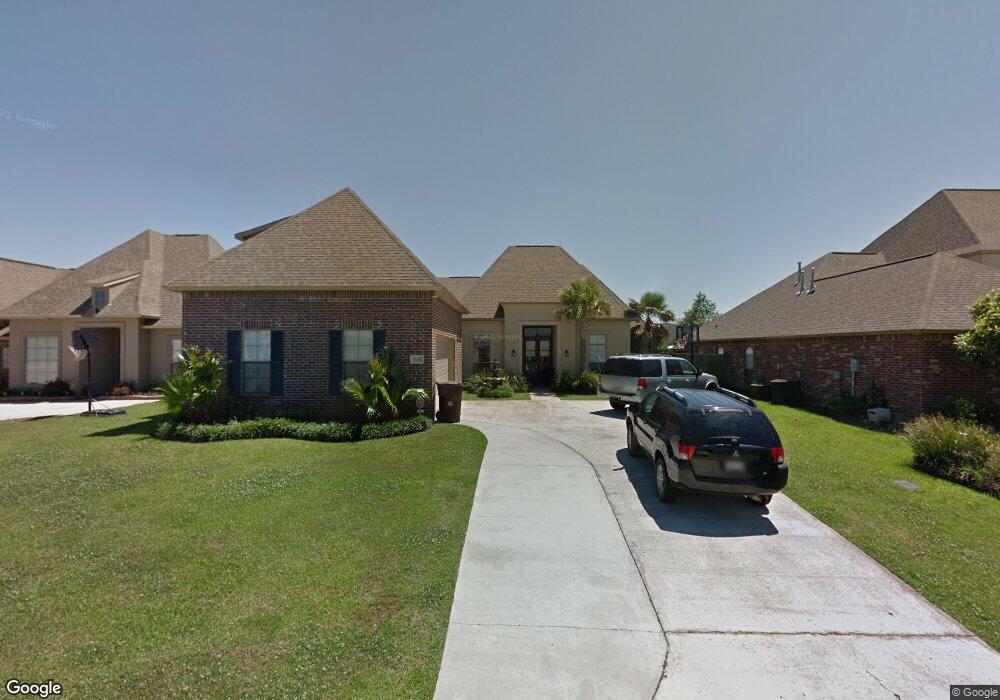
11348 Pleasant Knoll Dr Denham Springs, LA 70726
Estimated Value: $314,000 - $350,000
4
Beds
3
Baths
3,179
Sq Ft
$107/Sq Ft
Est. Value
About This Home
This home is located at 11348 Pleasant Knoll Dr, Denham Springs, LA 70726 and is currently estimated at $339,745, approximately $106 per square foot. 11348 Pleasant Knoll Dr is a home located in Livingston Parish with nearby schools including Juban Parc Elementary School, Juban Parc Junior High School, and Denham Springs Freshman High School.
Ownership History
Date
Name
Owned For
Owner Type
Purchase Details
Closed on
Jul 2, 2007
Sold by
Triche Bryant John Earl and Triche Bryant Tammy Marie
Bought by
Browning Neil Robert and Browning Pamela Cyldell Long
Current Estimated Value
Home Financials for this Owner
Home Financials are based on the most recent Mortgage that was taken out on this home.
Original Mortgage
$200,859
Outstanding Balance
$124,952
Interest Rate
6.41%
Mortgage Type
New Conventional
Estimated Equity
$214,793
Purchase Details
Closed on
Mar 18, 2005
Sold by
Pcc Home Builders Inc
Bought by
Bryant John E and Bryant Tammy M
Home Financials for this Owner
Home Financials are based on the most recent Mortgage that was taken out on this home.
Original Mortgage
$145,000
Interest Rate
5.71%
Mortgage Type
New Conventional
Create a Home Valuation Report for This Property
The Home Valuation Report is an in-depth analysis detailing your home's value as well as a comparison with similar homes in the area
Home Values in the Area
Average Home Value in this Area
Purchase History
| Date | Buyer | Sale Price | Title Company |
|---|---|---|---|
| Browning Neil Robert | $282,900 | Cypress Title Inc | |
| Bryant John E | $185,000 | Provident Title Company Inc |
Source: Public Records
Mortgage History
| Date | Status | Borrower | Loan Amount |
|---|---|---|---|
| Open | Browning Neil Robert | $200,859 | |
| Previous Owner | Bryant John E | $145,000 |
Source: Public Records
Tax History Compared to Growth
Tax History
| Year | Tax Paid | Tax Assessment Tax Assessment Total Assessment is a certain percentage of the fair market value that is determined by local assessors to be the total taxable value of land and additions on the property. | Land | Improvement |
|---|---|---|---|---|
| 2024 | $3,635 | $34,856 | $2,430 | $32,426 |
| 2023 | $3,095 | $25,610 | $2,430 | $23,180 |
| 2022 | $3,117 | $25,610 | $2,430 | $23,180 |
| 2021 | $2,742 | $25,610 | $2,430 | $23,180 |
| 2020 | $2,728 | $25,610 | $2,430 | $23,180 |
| 2019 | $3,011 | $27,540 | $2,430 | $25,110 |
| 2018 | $3,038 | $27,540 | $2,430 | $25,110 |
| 2017 | $3,107 | $27,540 | $2,430 | $25,110 |
| 2015 | $2,323 | $27,540 | $2,430 | $25,110 |
| 2014 | $2,361 | $27,540 | $2,430 | $25,110 |
Source: Public Records
Map
Nearby Homes
- 11372 Pleasant Knoll Dr
- 11411 Pleasant Knoll Dr
- 11414 Pleasant Knoll Dr
- 11407 Lemonwood Dr
- 11336 Meadow View Dr
- 11372 Densmore Dr
- 11257 Abbey Ln
- Abbey IV H Plan at Ellis Estates
- Abbey IV G Plan at Ellis Estates
- Leonardo IV G Plan at Ellis Estates
- Birkenhead III H Plan at Ellis Estates
- Birkenhead III G Plan at Ellis Estates
- Massimo II H Plan at Ellis Estates
- Domenico III B Plan at Ellis Estates
- Domenico III A Plan at Ellis Estates
- Alfani III H Plan at Ellis Estates
- Alfani III G Plan at Ellis Estates
- Ricci III H Plan at Ellis Estates
- Ricci III G Plan at Ellis Estates
- Botticelli III H Plan at Ellis Estates
- 11340 Pleasant Knoll Dr
- 11356 Pleasant Knoll Dr
- 11332 Pleasant Knoll Dr
- 11364 Pleasant Knoll Dr
- 11333 Hampton Ct
- 11339 Hampton Ct
- 11327 Hampton Ct
- 11345 Hampton Ct
- 11351 Pleasant Knoll Dr
- 11321 Hampton Ct
- 11324 Pleasant Knoll Dr
- 11343 Pleasant Knoll Dr
- 11351 Hampton Ct
- 11359 Pleasant Knoll Dr
- 11335 Pleasant Knoll Dr
- 126 Pleasant Knoll Dr
- 145 Pleasant Knoll Dr
- 143 Pleasant Knoll Dr
- 11367 Pleasant Knoll Dr
- 11357 Hampton Ct