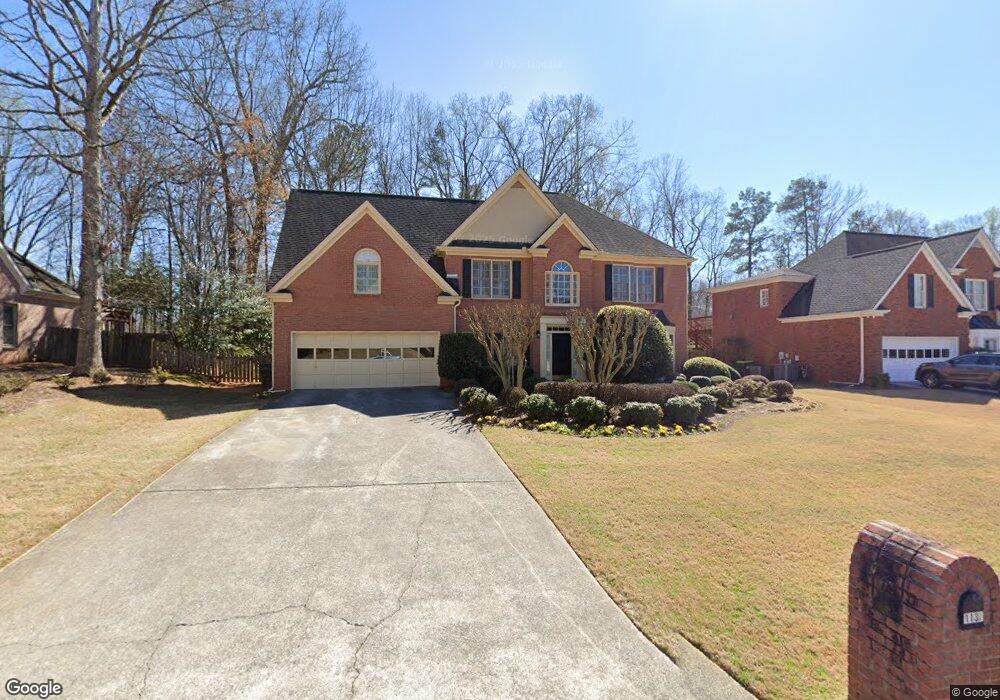
1135 Annie Ln SW Unit 2 Mableton, GA 30126
Estimated Value: $446,196 - $476,000
4
Beds
3
Baths
2,616
Sq Ft
$175/Sq Ft
Est. Value
About This Home
This home is located at 1135 Annie Ln SW Unit 2, Mableton, GA 30126 and is currently estimated at $456,549, approximately $174 per square foot. 1135 Annie Ln SW Unit 2 is a home located in Cobb County with nearby schools including Deerwood Elementary School, Mableton Elementary School, and Floyd Middle School.
Ownership History
Date
Name
Owned For
Owner Type
Purchase Details
Closed on
Jun 1, 2022
Sold by
Alexander Nixon Julie and Alexander Torrence
Bought by
Nixon Julie Alexander
Current Estimated Value
Home Financials for this Owner
Home Financials are based on the most recent Mortgage that was taken out on this home.
Original Mortgage
$323,972
Outstanding Balance
$307,766
Interest Rate
5.25%
Mortgage Type
FHA
Estimated Equity
$148,783
Purchase Details
Closed on
May 21, 1999
Sold by
Phillips Sheila M
Bought by
Nixon Julie A and Nixon Torrence
Home Financials for this Owner
Home Financials are based on the most recent Mortgage that was taken out on this home.
Original Mortgage
$216,600
Interest Rate
7.13%
Mortgage Type
New Conventional
Purchase Details
Closed on
Dec 18, 1998
Sold by
Rickard Phillip A
Bought by
Phillisp Sheila M
Purchase Details
Closed on
Mar 1, 1996
Sold by
Live Oaks Builders Inc
Bought by
Rickard Phillip A and Phillips Shelia M
Create a Home Valuation Report for This Property
The Home Valuation Report is an in-depth analysis detailing your home's value as well as a comparison with similar homes in the area
Home Values in the Area
Average Home Value in this Area
Purchase History
| Date | Buyer | Sale Price | Title Company |
|---|---|---|---|
| Nixon Julie Alexander | -- | Pc Law Associates | |
| Nixon Julie A | $228,000 | -- | |
| Phillisp Sheila M | -- | -- | |
| Rickard Phillip A | $182,500 | -- |
Source: Public Records
Mortgage History
| Date | Status | Borrower | Loan Amount |
|---|---|---|---|
| Open | Nixon Julie Alexander | $323,972 | |
| Previous Owner | Nixon Julie A | $216,600 | |
| Closed | Rickard Phillip A | $0 |
Source: Public Records
Tax History Compared to Growth
Tax History
| Year | Tax Paid | Tax Assessment Tax Assessment Total Assessment is a certain percentage of the fair market value that is determined by local assessors to be the total taxable value of land and additions on the property. | Land | Improvement |
|---|---|---|---|---|
| 2025 | $5,926 | $196,668 | $32,000 | $164,668 |
| 2024 | $5,930 | $196,668 | $32,000 | $164,668 |
| 2023 | $4,514 | $149,712 | $20,000 | $129,712 |
| 2022 | $4,544 | $149,712 | $20,000 | $129,712 |
| 2021 | $3,617 | $119,172 | $20,000 | $99,172 |
| 2020 | $3,199 | $105,404 | $20,000 | $85,404 |
| 2019 | $3,199 | $105,404 | $20,000 | $85,404 |
| 2018 | $3,199 | $105,404 | $20,000 | $85,404 |
| 2017 | $3,030 | $105,404 | $20,000 | $85,404 |
| 2016 | $2,556 | $88,904 | $20,000 | $68,904 |
| 2015 | $2,693 | $91,416 | $23,400 | $68,016 |
| 2014 | $2,716 | $91,416 | $0 | $0 |
Source: Public Records
Map
Nearby Homes
- 8009 Haven Springs Trace
- 8029 Haven Springs Trace
- 8025 Haven Springs Trace
- 8041 Haven Springs Trace
- 4690 Glore Rd SW
- 4556 Sweetlake Rd SW
- Linden Plan at Sweetlake Grove - Bungalow Series
- 4612 Springside Ct SW
- 971 Verlander Trail
- 960 Verlander Trail
- 1056 Retner Dr SW Unit 3
- 1047 Retner Dr SW
- 4976 Mable Lake Dr SW
- 4938 White Blvd SW
- 4167 Waratah Way
- 1078 Hibiscus Way SW
- Kaufman Plan at Wilkins Walk
- Bryson Plan at Wilkins Walk
- 1137 Annie Ln SW
- 1133 Annie Ln SW Unit 2
- 1139 Annie Ln SW Unit 2
- 1131 Annie Ln SW Unit 2
- 1178 Trenton Ct SW
- 0 Annie Ln Unit 7287489
- 0 Annie Ln Unit 8825816
- 0 Annie Ln Unit 8367336
- 0 Annie Ln Unit 8240338
- 0 Annie Ln Unit 8093959
- 0 Annie Ln Unit 8045783
- 0 Annie Ln
- 1176 Trenton Ct SW
- 1128 Annie Ln SW Unit II
- 1126 Annie Ln SW
- 1174 Trenton Ct SW
- 1141 Annie Ln SW Unit 2
- 1180 Trenton Ct SW
- 1124 Annie Ln SW
- 1130 Annie Ln SW