Estimated Value: $260,209 - $332,000
2
Beds
2
Baths
1,656
Sq Ft
$184/Sq Ft
Est. Value
About This Home
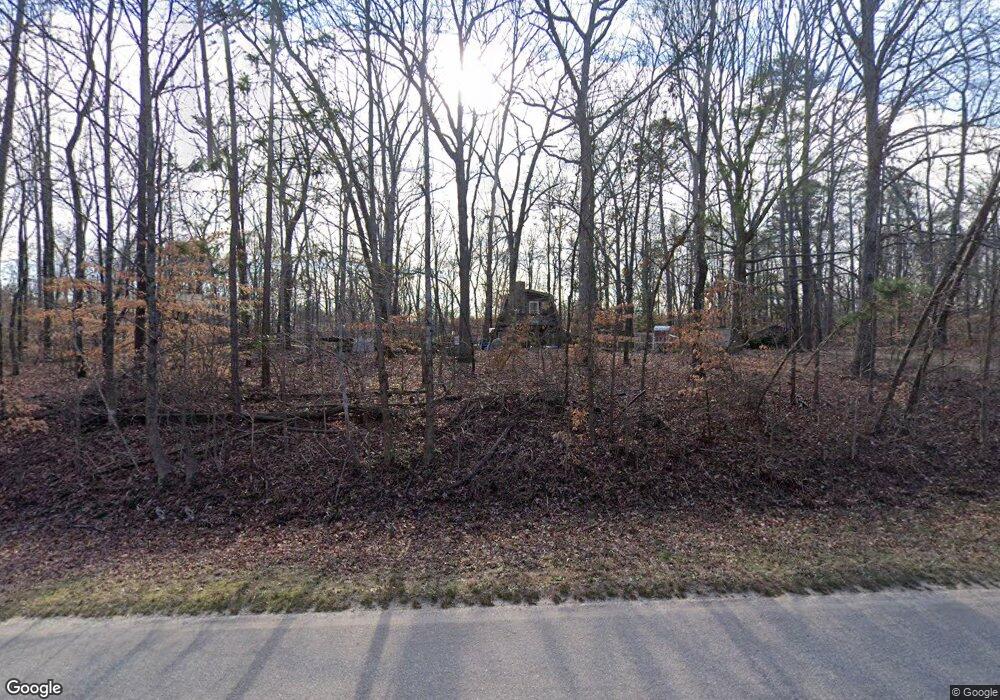
This home is located at 1135 Garnett Ward Rd, Hull, GA 30646 and is currently estimated at $304,552, approximately $183 per square foot. 1135 Garnett Ward Rd is a home located in Madison County with nearby schools including Madison County High School.
Ownership History
Date
Name
Owned For
Owner Type
Purchase Details
Closed on
Jan 26, 2007
Sold by
Homecomings Financial Llc
Bought by
Funk Adam C and Laughner Aleshia Renee
Current Estimated Value
Home Financials for this Owner
Home Financials are based on the most recent Mortgage that was taken out on this home.
Original Mortgage
$65,405
Outstanding Balance
$39,131
Interest Rate
6.14%
Mortgage Type
New Conventional
Estimated Equity
$265,421
Purchase Details
Closed on
Sep 5, 2006
Sold by
Hughes Roy D
Bought by
Homecomings Financial Network
Purchase Details
Closed on
Oct 28, 2005
Sold by
Coleman David K
Bought by
Hughes Roy D
Home Financials for this Owner
Home Financials are based on the most recent Mortgage that was taken out on this home.
Original Mortgage
$104,400
Interest Rate
8.55%
Mortgage Type
New Conventional
Purchase Details
Closed on
Jul 28, 1999
Sold by
Tate L Kathryn
Bought by
Coleman Coleman and Coleman Bourquin
Purchase Details
Closed on
Jan 1, 1984
Bought by
Tate L Kathryn
Create a Home Valuation Report for This Property
The Home Valuation Report is an in-depth analysis detailing your home's value as well as a comparison with similar homes in the area
Home Values in the Area
Average Home Value in this Area
Purchase History
| Date | Buyer | Sale Price | Title Company |
|---|---|---|---|
| Funk Adam C | $63,500 | -- | |
| Homecomings Financial Network | $102,000 | -- | |
| Hughes Roy D | $116,000 | -- | |
| Coleman Coleman | $85,000 | -- | |
| Tate L Kathryn | -- | -- |
Source: Public Records
Mortgage History
| Date | Status | Borrower | Loan Amount |
|---|---|---|---|
| Open | Funk Adam C | $65,405 | |
| Previous Owner | Hughes Roy D | $104,400 |
Source: Public Records
Tax History Compared to Growth
Tax History
| Year | Tax Paid | Tax Assessment Tax Assessment Total Assessment is a certain percentage of the fair market value that is determined by local assessors to be the total taxable value of land and additions on the property. | Land | Improvement |
|---|---|---|---|---|
| 2024 | $1,594 | $63,246 | $9,702 | $53,544 |
| 2023 | $1,769 | $57,957 | $8,085 | $49,872 |
| 2022 | $1,303 | $49,240 | $5,560 | $43,680 |
| 2021 | $1,113 | $38,445 | $5,560 | $32,885 |
| 2020 | $1,095 | $37,637 | $4,752 | $32,885 |
| 2019 | $1,084 | $36,868 | $4,752 | $32,116 |
| 2018 | $1,043 | $35,444 | $4,347 | $31,097 |
| 2017 | $981 | $34,071 | $4,042 | $30,029 |
| 2016 | $759 | $28,429 | $3,674 | $24,755 |
| 2015 | $759 | $28,429 | $3,674 | $24,755 |
| 2014 | $782 | $29,061 | $3,692 | $25,370 |
| 2013 | -- | $29,061 | $3,692 | $25,370 |
Source: Public Records
Map
Nearby Homes
- 1045 Garnett Ward Rd Unit 4
- 1061 Garnett Ward Rd Unit 3
- 1067 Garnett Ward Rd Unit 2
- 1097 Garnett Ward Rd Unit 1
- 103 Three Rivers Ct
- 149 Candlestick Dr
- 465 Stone Creek Dr
- 1176 Kimberly Cir
- 7241 Highway 29 S
- 210 Joe Graham Rd
- 260 Oak Cir
- 166 Oak Cir
- 1329 Spratlin Mill Dr
- 8986 Highway 29 S
- 151 Rolling Woods Ln
- 905 Adams Duncan Rd
- 424 Belhaven Ln
- 685 Bedford Dr
- 181 Bedford Dr
- 136 Wellington Dr
- 00 Garnett Ward Rd
- 0 Garnett Ward Rd Unit CM985000
- 18 AC Garnett Ward Rd
- 0 Garnett Ward Rd Unit CM414876
- 0 Garnett Ward Rd Unit 7449343
- 0 Garnett Ward Rd Unit 10010361
- 0 Garnett Ward Rd Unit 8349673
- 0 Garnett Ward Rd Unit 8201717
- 0 Garnett Ward Rd Unit 8313821
- 0 Garnett Ward Rd Unit 7265452
- 0 Garnett Ward Rd Unit 9075072
- 1160 Garnett Ward Rd
- 49 E Piedmont Park
- 1185 Garnett Ward Rd
- 94 E Piedmont Park
- 70 Piedmont Park
- 986 Garnett Ward Rd
- E E Piedmont Park
- 529 Piedmont Park
- 529 Piedmont Park Unit 17