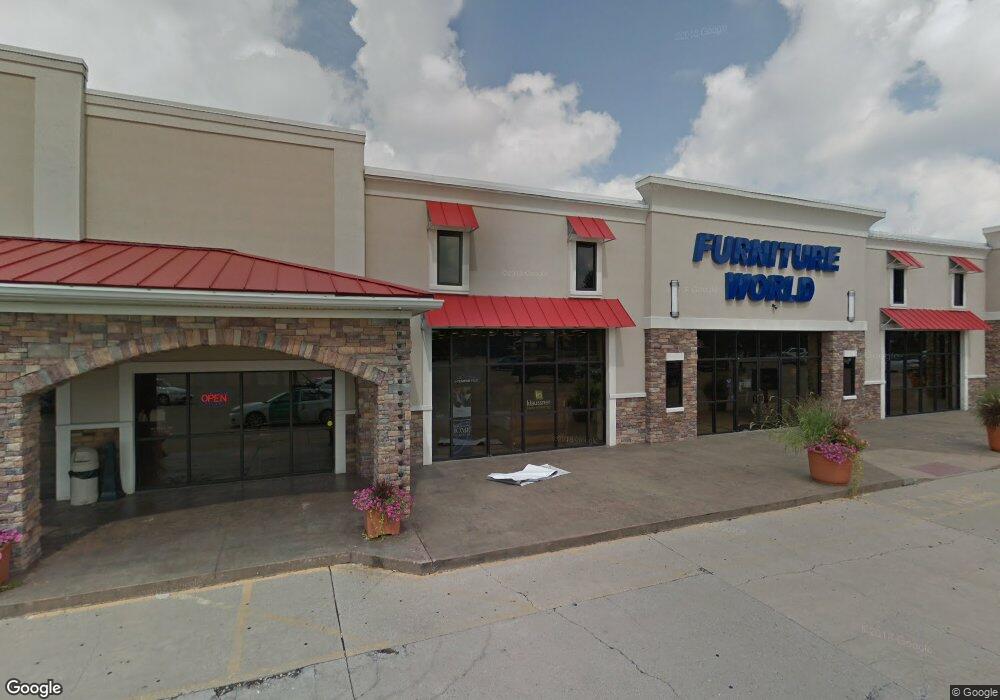
1135 Lexington Rd Georgetown, KY 40324
Bradford Place Neighborhood
--
Bed
--
Bath
21,000
Sq Ft
--
Built
About This Home
This home is located at 1135 Lexington Rd, Georgetown, KY 40324. 1135 Lexington Rd is a home located in Scott County with nearby schools including Southern Elementary School, Creekside Elementary School, and Georgetown Middle School.
Ownership History
Date
Name
Owned For
Owner Type
Purchase Details
Closed on
May 30, 2025
Sold by
Matt Welch Development Group and Premier Construction Llc
Bought by
Cash Nolan Paul
Purchase Details
Closed on
May 18, 2023
Sold by
Ward Sam and Ward Sue
Bought by
Paynes Depot Partners Llc
Purchase Details
Closed on
Feb 27, 2023
Sold by
Simply Southern Properties Llc
Bought by
Bourbon Street Partners Llc
Purchase Details
Closed on
Oct 10, 2022
Sold by
Simply Southern Properties Llc
Bought by
Bourbon Street Partners Llc
Purchase Details
Closed on
Dec 14, 2020
Sold by
Water Street Partners Llc
Bought by
Welch Real Estate Holdings Llc
Purchase Details
Closed on
Aug 19, 2011
Sold by
Eagle Pass Partners
Bought by
Land Crossing Llc
Home Financials for this Owner
Home Financials are based on the most recent Mortgage that was taken out on this home.
Original Mortgage
$1,220,000
Interest Rate
4.53%
Mortgage Type
Construction
Create a Home Valuation Report for This Property
The Home Valuation Report is an in-depth analysis detailing your home's value as well as a comparison with similar homes in the area
Home Values in the Area
Average Home Value in this Area
Purchase History
| Date | Buyer | Sale Price | Title Company |
|---|---|---|---|
| Cash Nolan Paul | $50,000 | None Listed On Document | |
| Cash Nolan Paul | $50,000 | None Listed On Document | |
| Paynes Depot Partners Llc | $28,500 | None Listed On Document | |
| Paynes Depot Partners Llc | $28,500 | None Listed On Document | |
| Bourbon Street Partners Llc | $3,000 | -- | |
| Bourbon Street Partners Llc | $3,000 | -- | |
| Welch Real Estate Holdings Llc | $50,000 | None Available | |
| Land Crossing Llc | $825,000 | None Available |
Source: Public Records
Mortgage History
| Date | Status | Borrower | Loan Amount |
|---|---|---|---|
| Previous Owner | Land Crossing Llc | $1,220,000 |
Source: Public Records
Tax History Compared to Growth
Tax History
| Year | Tax Paid | Tax Assessment Tax Assessment Total Assessment is a certain percentage of the fair market value that is determined by local assessors to be the total taxable value of land and additions on the property. | Land | Improvement |
|---|---|---|---|---|
| 2024 | $26,715 | $2,970,682 | $0 | $0 |
| 2023 | $26,935 | $2,970,682 | $1,350,000 | $1,620,682 |
| 2022 | $25,258 | $2,970,682 | $1,350,000 | $1,620,682 |
| 2021 | $27,984 | $2,970,682 | $1,350,000 | $1,620,682 |
| 2020 | $21,269 | $2,475,568 | $1,350,000 | $1,125,568 |
| 2019 | $21,607 | $2,475,568 | $0 | $0 |
| 2018 | $21,483 | $2,475,568 | $0 | $0 |
| 2017 | $21,587 | $2,475,568 | $0 | $0 |
| 2016 | $19,933 | $2,475,568 | $0 | $0 |
| 2015 | $18,607 | $2,325,580 | $0 | $0 |
| 2014 | $18,521 | $2,233,839 | $0 | $0 |
| 2011 | $930 | $1,500,000 | $0 | $0 |
Source: Public Records
Map
Nearby Homes
- 1020 Parkside Dr
- 107 Oconner Ct
- 127 E Chopin Way
- 1338 Liberty Dr Unit A and B
- The Laurel Square Plan at South Crossing - Trend Collection
- The Sycamore Bend Plan at South Crossing - Trend Collection
- The Newbury Cross Plan at South Crossing - Trend Collection
- The Haywood Park Plan at South Crossing - Trend Collection
- The Sutton Bay Plan at South Crossing - Trend Collection
- The Bayberry Lane Plan at South Crossing - Trend Collection
- The Barclay Point Plan at South Crossing - Trend Collection
- The Dover Glen Plan at South Crossing - Trend Collection
- The Bedford Hill Plan at South Crossing - Trend Collection
- The Oak Bluff Plan at South Crossing - Trend Collection
- The Gaines Mill Plan at South Crossing - Trend Collection
- 151 Hemingway Place
- 128 Warren Pass
- 1363 Bridges Creek Ct
- 139 E Showalter Dr
- 102 Browning Dr
- 0 Airport Rd
- 1141 Lexington Rd
- 1153 Lexington Rd
- 1163 S Broadway St
- 1163 Lexington Rd
- 1000 Parkside Dr
- 1002 Parkside Dr
- 1004 Parkside Dr
- 1006 Parkside Dr
- 1008 Parkside Dr
- 1031 Lexington Rd
- 1010 Parkside Dr
- 1012 Parkside Dr
- 1100 Lexington Rd
- 1175 Lexington Rd
- 1014 Parkside Dr
- 120 Marketplace Cir
- 1138 Lexington Rd
- 1016 Parkside Dr
- 1001 Parkside Dr