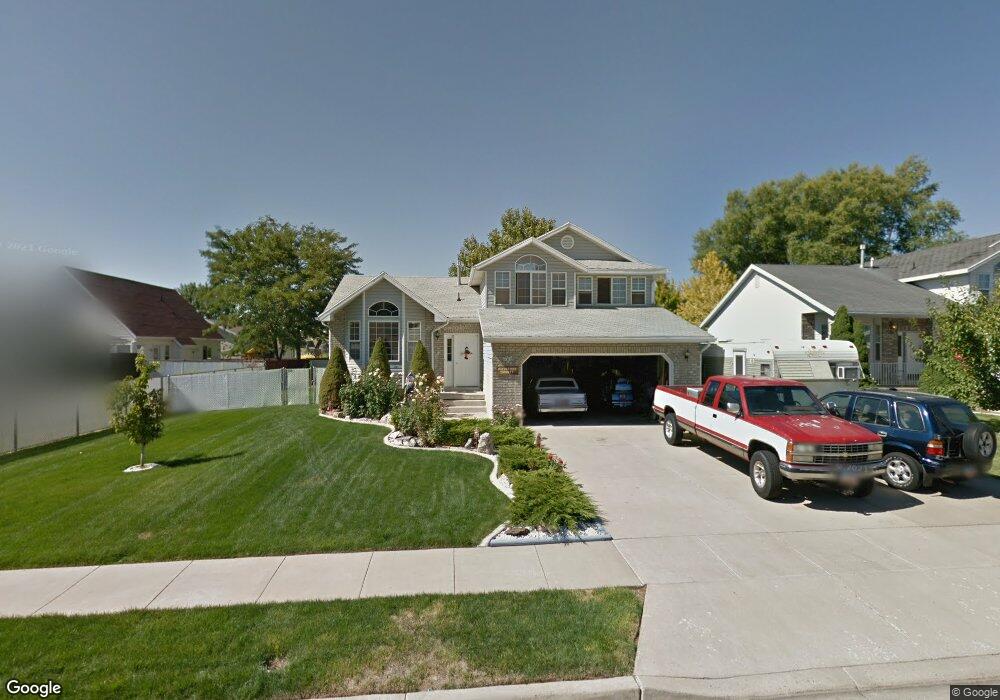
1135 N 2775 W Layton, UT 84041
Estimated Value: $502,000 - $508,000
3
Beds
3
Baths
2,232
Sq Ft
$227/Sq Ft
Est. Value
About This Home
This home is located at 1135 N 2775 W, Layton, UT 84041 and is currently estimated at $506,170, approximately $226 per square foot. 1135 N 2775 W is a home located in Davis County with nearby schools including Legacy Junior High School, Layton High School, and North Davis Preparatory Academy.
Ownership History
Date
Name
Owned For
Owner Type
Purchase Details
Closed on
Sep 14, 2018
Sold by
Maez Michael F and Maez Kaye E
Bought by
Bluma John Armando and Bluma Carrie Elizabeth
Current Estimated Value
Home Financials for this Owner
Home Financials are based on the most recent Mortgage that was taken out on this home.
Original Mortgage
$271,491
Outstanding Balance
$234,972
Interest Rate
4.25%
Mortgage Type
FHA
Estimated Equity
$271,198
Purchase Details
Closed on
Jun 13, 2013
Sold by
Maez Michael F and Maez Kaye E
Bought by
Maez Michael F and Maez Kaye E
Create a Home Valuation Report for This Property
The Home Valuation Report is an in-depth analysis detailing your home's value as well as a comparison with similar homes in the area
Home Values in the Area
Average Home Value in this Area
Purchase History
| Date | Buyer | Sale Price | Title Company |
|---|---|---|---|
| Bluma John Armando | -- | Us Title Company Of | |
| Maez Michael F | -- | None Available |
Source: Public Records
Mortgage History
| Date | Status | Borrower | Loan Amount |
|---|---|---|---|
| Open | Bluma John Armando | $271,491 |
Source: Public Records
Tax History Compared to Growth
Tax History
| Year | Tax Paid | Tax Assessment Tax Assessment Total Assessment is a certain percentage of the fair market value that is determined by local assessors to be the total taxable value of land and additions on the property. | Land | Improvement |
|---|---|---|---|---|
| 2025 | $2,526 | $265,100 | $110,008 | $155,092 |
| 2024 | $2,424 | $256,300 | $121,876 | $134,424 |
| 2023 | $2,302 | $429,000 | $120,223 | $308,777 |
| 2022 | $2,516 | $254,650 | $75,437 | $179,213 |
| 2021 | $2,292 | $346,000 | $113,183 | $232,817 |
| 2020 | $1,961 | $284,000 | $95,127 | $188,873 |
| 2019 | $1,904 | $270,000 | $97,983 | $172,017 |
| 2018 | $1,721 | $245,000 | $85,896 | $159,104 |
| 2016 | $1,607 | $118,030 | $33,553 | $84,477 |
| 2015 | $1,521 | $106,040 | $33,553 | $72,487 |
| 2014 | $1,468 | $104,703 | $33,553 | $71,150 |
| 2013 | -- | $101,001 | $28,952 | $72,049 |
Source: Public Records
Map
Nearby Homes