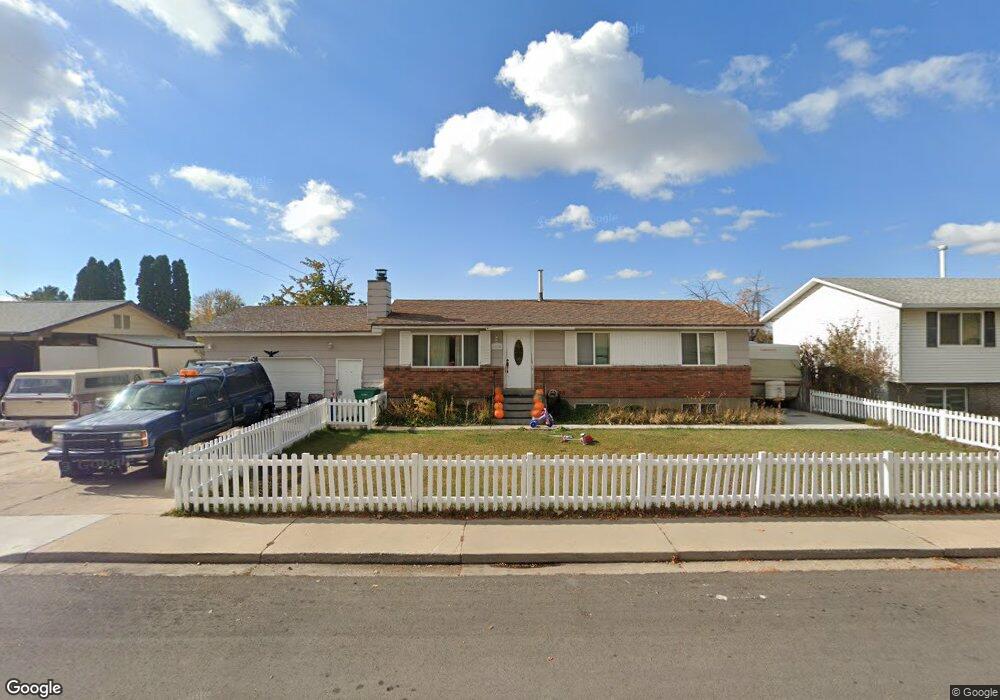
1135 N 800 W Orem, UT 84057
Bonneville NeighborhoodEstimated Value: $495,000 - $539,014
5
Beds
2
Baths
2,100
Sq Ft
$247/Sq Ft
Est. Value
About This Home
This home is located at 1135 N 800 W, Orem, UT 84057 and is currently estimated at $518,754, approximately $247 per square foot. 1135 N 800 W is a home located in Utah County with nearby schools including Bonneville Elementary School, Orem Junior High School, and Timpanogos High School.
Ownership History
Date
Name
Owned For
Owner Type
Purchase Details
Closed on
Nov 15, 2019
Sold by
Gordon Betty J
Bought by
Levaring Israel Scott and Levaring Hyrum Gordon
Current Estimated Value
Purchase Details
Closed on
Jun 30, 1997
Sold by
Hawks Richard D and Hawks Natalie J
Bought by
Gordon Betty J
Home Financials for this Owner
Home Financials are based on the most recent Mortgage that was taken out on this home.
Original Mortgage
$122,495
Outstanding Balance
$18,210
Interest Rate
7.92%
Mortgage Type
FHA
Estimated Equity
$500,544
Purchase Details
Closed on
Apr 22, 1997
Sold by
Hawks Richard D and Hawks Natalie J
Bought by
Hawks Richard D and Hawks Natalie J
Purchase Details
Closed on
Aug 15, 1996
Sold by
Brown Gregory J and Brown Diane H
Bought by
Hawks Richard D and Hawks Natalie J
Home Financials for this Owner
Home Financials are based on the most recent Mortgage that was taken out on this home.
Original Mortgage
$87,500
Interest Rate
8.18%
Create a Home Valuation Report for This Property
The Home Valuation Report is an in-depth analysis detailing your home's value as well as a comparison with similar homes in the area
Home Values in the Area
Average Home Value in this Area
Purchase History
We collect this data history from publicly available records. To have your information removed, we recommend requesting removal directly through your county’s website.
| Date | Buyer | Sale Price | Title Company |
|---|---|---|---|
| Levaring Israel Scott | -- | None Available | |
| Gordon Betty J | -- | -- | |
| Hawks Richard D | -- | -- | |
| Hawks Richard D | -- | -- |
Source: Public Records
Mortgage History
We collect this data history from publicly available records. To have your information removed, we recommend requesting removal directly through your county’s website.
| Date | Status | Borrower | Loan Amount |
|---|---|---|---|
| Open | Gordon Betty J | $122,495 | |
| Previous Owner | Hawks Richard D | $87,500 |
Source: Public Records
Tax History
| Year | Tax Paid | Tax Assessment Tax Assessment Total Assessment is a certain percentage of the fair market value that is determined by local assessors to be the total taxable value of land and additions on the property. | Land | Improvement |
|---|---|---|---|---|
| 2025 | $1,884 | $249,535 | -- | -- |
| 2024 | $1,884 | $230,340 | $0 | $0 |
| 2023 | $1,746 | $229,405 | $0 | $0 |
| 2022 | $1,707 | $217,305 | $0 | $0 |
| 2021 | $1,588 | $306,300 | $151,800 | $154,500 |
| 2020 | $1,440 | $272,900 | $121,400 | $151,500 |
| 2019 | $1,347 | $265,500 | $121,400 | $144,100 |
| 2018 | $1,315 | $247,600 | $111,000 | $136,600 |
| 2017 | $1,255 | $126,610 | $0 | $0 |
| 2016 | $1,264 | $117,535 | $0 | $0 |
| 2015 | $1,198 | $105,380 | $0 | $0 |
| 2014 | $1,154 | $101,090 | $0 | $0 |
Source: Public Records
Map
Nearby Homes
- 1226 N 900 W
- 1175 N 950 W
- 652 W 1100 N
- 999 W 1100 N
- 983 W 1055 N Unit 812
- 1018 N 985 W Unit 501
- 1030 N 995 W Unit 914
- 1015 N 995 W
- 1244 N 580 W
- 538 W 1120 N
- 645 W 920 N
- 1004 N 1090 W Unit 203
- 1028 W 1375 N
- 1079 W 965 N Unit 402
- 1140 W 950 N Unit D302
- 1140 W 950 N Unit D301
- 1140 W 950 N Unit B102
- 1140 W 950 N Unit C303
- 1140 W 950 N Unit C101
- 1140 W 950 N Unit D304
Your Personal Tour Guide
Ask me questions while you tour the home.