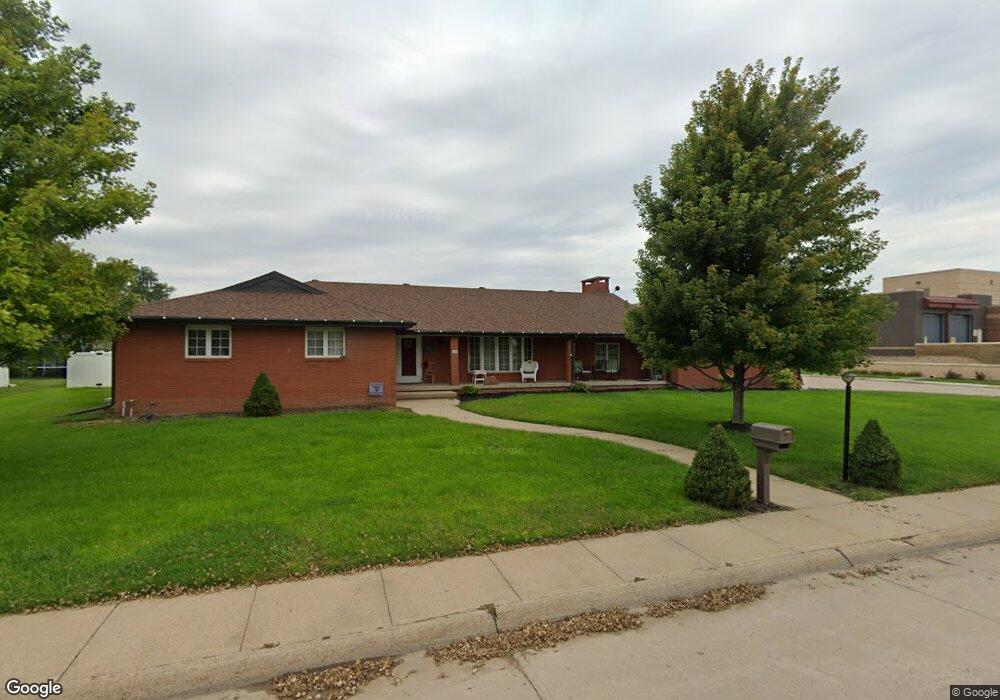
1135 Tibbals St Holdrege, NE 68949
Estimated Value: $329,000 - $538,000
--
Bed
--
Bath
2,339
Sq Ft
$175/Sq Ft
Est. Value
About This Home
This home is located at 1135 Tibbals St, Holdrege, NE 68949 and is currently estimated at $410,201, approximately $175 per square foot. 1135 Tibbals St is a home located in Phelps County with nearby schools including Holdrege Elementary School, Holdrege Middle School, and Holdrege High School.
Ownership History
Date
Name
Owned For
Owner Type
Purchase Details
Closed on
Oct 22, 2021
Sold by
Hunter Travis L and Hunter Michelle T
Bought by
Hunter Travis L and Hunter Michelle T
Current Estimated Value
Purchase Details
Closed on
Jul 31, 2015
Sold by
Crocker Karen Ann and Estate Of Marlin L Jones
Bought by
Hunter Travis L
Home Financials for this Owner
Home Financials are based on the most recent Mortgage that was taken out on this home.
Original Mortgage
$225,000
Interest Rate
4.07%
Mortgage Type
VA
Purchase Details
Closed on
Sep 10, 2013
Sold by
Storrs Shirley and Storrs James
Bought by
Storrs Shirley and Storrs James
Home Financials for this Owner
Home Financials are based on the most recent Mortgage that was taken out on this home.
Original Mortgage
$100,000
Interest Rate
3.59%
Create a Home Valuation Report for This Property
The Home Valuation Report is an in-depth analysis detailing your home's value as well as a comparison with similar homes in the area
Home Values in the Area
Average Home Value in this Area
Purchase History
| Date | Buyer | Sale Price | Title Company |
|---|---|---|---|
| Hunter Travis L | -- | None Listed On Document | |
| Hunter Travis L | $225,000 | None Available | |
| Storrs Shirley | $5,000 | None Available |
Source: Public Records
Mortgage History
| Date | Status | Borrower | Loan Amount |
|---|---|---|---|
| Previous Owner | Hunter Travis L | $225,000 | |
| Previous Owner | Storrs Shirley | $100,000 |
Source: Public Records
Tax History Compared to Growth
Tax History
| Year | Tax Paid | Tax Assessment Tax Assessment Total Assessment is a certain percentage of the fair market value that is determined by local assessors to be the total taxable value of land and additions on the property. | Land | Improvement |
|---|---|---|---|---|
| 2024 | $5,990 | $436,548 | $30,638 | $405,910 |
| 2023 | $5,990 | $379,278 | $24,188 | $355,090 |
| 2022 | $5,656 | $334,195 | $24,150 | $310,045 |
| 2021 | $4,947 | $283,340 | $24,150 | $259,190 |
| 2020 | $4,972 | $283,340 | $24,150 | $259,190 |
| 2019 | $4,408 | $256,980 | $24,150 | $232,830 |
| 2018 | $4,393 | $245,540 | $24,150 | $221,390 |
| 2017 | $3,828 | $207,430 | $20,930 | $186,500 |
| 2016 | $3,478 | $189,245 | $20,930 | $168,315 |
| 2015 | $3,540 | $189,245 | $20,930 | $168,315 |
| 2014 | $3,495 | $205,065 | $20,930 | $184,135 |
| 2013 | $3,495 | $205,065 | $20,930 | $184,135 |
Source: Public Records
Map
Nearby Homes
- 1223 Broadway St
- 920 West Ave
- 117 W 3rd Ave
- 816 Garfield St
- 419 Sherman St
- 1326 10th Ave
- 1406 Pamela Ave
- 11491 729 Rd
- 722 Rd
- 809 A Ave
- 402 2nd Ave
- Lots 5-7 Block 3 Craneview Third S Road Awarii Dunes
- L1B2 Craneview 3rd Subdivison
- 201 Medina Ave
- 213 Minor Ave
- 74769 L Rd
- Odess Unit a NE 68861
- Bertrand Unit NE 68927
- 4 Tulleymore Ln
- 11 Quail Run
- 1131 Tibbals St
- 215 W 12th Ave
- 1130 Mcmillan St
- 1134 Tibbals St
- 1125 Tibbals St
- 1130 Tibbals St
- 1122 Mcmillan St
- 1124 Tibbals St
- 1117 Tibbals St
- 1118 Mcmillan St
- 1116 Tibbals St
- 1135 Hill St
- 1131 Hill St
- 1135 Mcmillan St
- 1125 Hill St
- 1111 Tibbals St
- 1112 Mcmillan St
- 1121 Mcmillan St
- 1121 Hill St
- 1110 Tibbals St