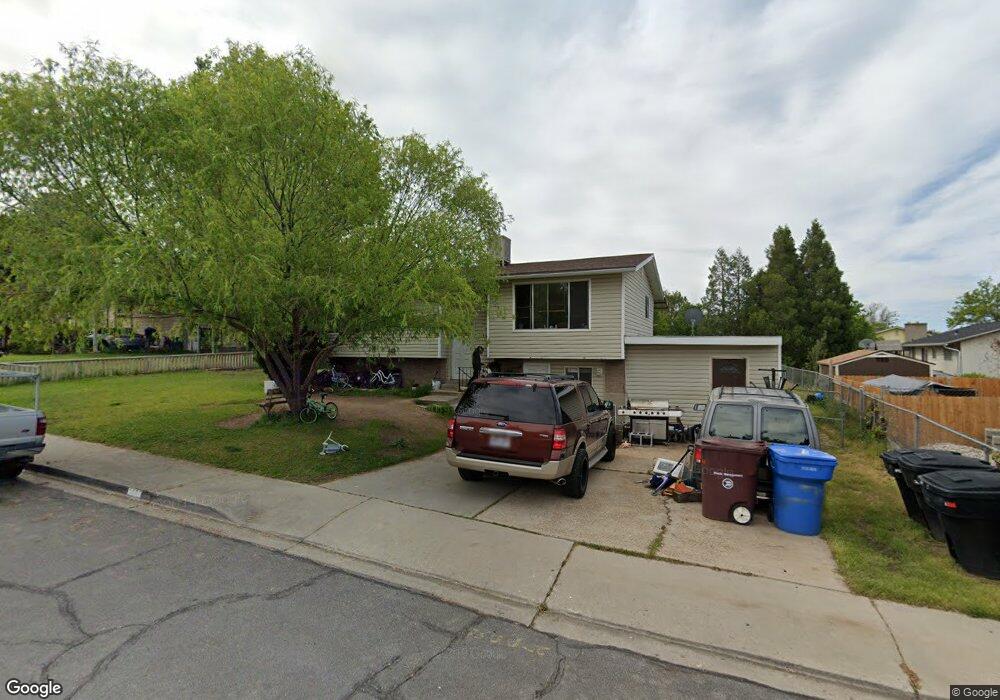
1135 W 1300 N Orem, UT 84057
Bonneville NeighborhoodEstimated Value: $467,775 - $472,000
5
Beds
2
Baths
1,918
Sq Ft
$245/Sq Ft
Est. Value
About This Home
This home is located at 1135 W 1300 N, Orem, UT 84057 and is currently estimated at $470,592, approximately $245 per square foot. 1135 W 1300 N is a home located in Utah County with nearby schools including Bonneville Elementary School, Orem Junior High School, and Timpanogos High School.
Ownership History
Date
Name
Owned For
Owner Type
Purchase Details
Closed on
Oct 5, 2005
Sold by
Martin Mark D
Bought by
Salas Miguel
Current Estimated Value
Home Financials for this Owner
Home Financials are based on the most recent Mortgage that was taken out on this home.
Original Mortgage
$29,400
Outstanding Balance
$204
Interest Rate
5.67%
Mortgage Type
Stand Alone Second
Estimated Equity
$470,388
Purchase Details
Closed on
May 24, 1999
Sold by
Martin Mark D and Martin Estina L
Bought by
Martin Mark D
Home Financials for this Owner
Home Financials are based on the most recent Mortgage that was taken out on this home.
Original Mortgage
$104,000
Interest Rate
6.84%
Purchase Details
Closed on
May 10, 1996
Sold by
Martin Mark D and Martin Estina L
Bought by
Martin Mark D and Martin Estina L
Create a Home Valuation Report for This Property
The Home Valuation Report is an in-depth analysis detailing your home's value as well as a comparison with similar homes in the area
Home Values in the Area
Average Home Value in this Area
Purchase History
| Date | Buyer | Sale Price | Title Company |
|---|---|---|---|
| Salas Miguel | -- | Advantage Title Company | |
| Martin Mark D | -- | First American Title Co | |
| Martin Mark D | -- | Provo Land Title Company |
Source: Public Records
Mortgage History
| Date | Status | Borrower | Loan Amount |
|---|---|---|---|
| Open | Salas Miguel | $29,400 | |
| Open | Salas Miguel | $117,600 | |
| Previous Owner | Martin Mark D | $104,000 |
Source: Public Records
Tax History
| Year | Tax Paid | Tax Assessment Tax Assessment Total Assessment is a certain percentage of the fair market value that is determined by local assessors to be the total taxable value of land and additions on the property. | Land | Improvement |
|---|---|---|---|---|
| 2025 | $1,837 | $231,825 | -- | -- |
| 2024 | $1,837 | $224,675 | $0 | $0 |
| 2023 | $1,720 | $226,105 | $0 | $0 |
| 2022 | $1,730 | $220,220 | $0 | $0 |
| 2021 | $1,610 | $310,500 | $151,800 | $158,700 |
| 2020 | $1,461 | $277,000 | $121,400 | $155,600 |
| 2019 | $1,325 | $261,200 | $121,400 | $139,800 |
| 2018 | $1,251 | $235,600 | $111,000 | $124,600 |
| 2017 | $1,197 | $120,725 | $0 | $0 |
| 2016 | $1,167 | $108,570 | $0 | $0 |
| 2015 | $1,128 | $99,275 | $0 | $0 |
| 2014 | $1,088 | $95,315 | $0 | $0 |
Source: Public Records
Map
Nearby Homes
- 1499 N 1200 W Unit 8
- 1167 W 1550 N
- 1535 N 950 W
- 1069 N 1160 W
- 999 W 1100 N
- 1062 N 1035 W
- 1004 N 1090 W Unit 203
- 967 W 1630 N
- 1140 W 950 N Unit D302
- 1140 W 950 N Unit D304
- 1140 W 950 N Unit A401
- 1405 N 770 W
- 1123 N 800 W
- 930 N 980 W
- 1645 W 1600 N
- 582 W 1300 N
- 545 W 1240 N
- 531 W 1350 N
- 538 W 1120 N
- 1917 N 860 W
Your Personal Tour Guide
Ask me questions while you tour the home.