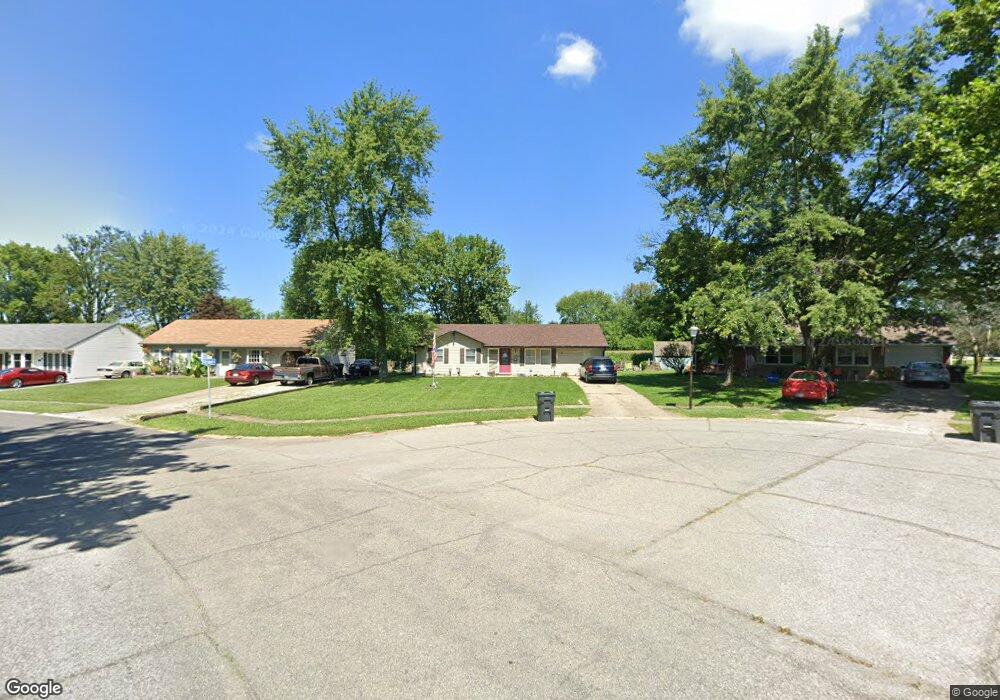
1135 Warwick Rd Whiteland, IN 46184
Estimated Value: $220,000 - $269,000
4
Beds
1
Bath
1,250
Sq Ft
$198/Sq Ft
Est. Value
About This Home
This home is located at 1135 Warwick Rd, Whiteland, IN 46184 and is currently estimated at $247,642, approximately $198 per square foot. 1135 Warwick Rd is a home located in Johnson County with nearby schools including Break-O-Day Elementary School, Clark-Pleasant Middle School, and Whiteland Community High School.
Ownership History
Date
Name
Owned For
Owner Type
Purchase Details
Closed on
Sep 25, 2024
Sold by
Price Michael D
Bought by
Price Michael D and Price Julie Ann
Current Estimated Value
Home Financials for this Owner
Home Financials are based on the most recent Mortgage that was taken out on this home.
Original Mortgage
$252,000
Outstanding Balance
$248,671
Interest Rate
6.46%
Mortgage Type
VA
Estimated Equity
-$1,029
Purchase Details
Closed on
Dec 28, 2022
Sold by
Franklin Julie Ann
Bought by
Price Michael D
Home Financials for this Owner
Home Financials are based on the most recent Mortgage that was taken out on this home.
Original Mortgage
$195,000
Interest Rate
6.49%
Mortgage Type
VA
Purchase Details
Closed on
Feb 17, 2006
Sold by
Powell Luann
Bought by
Franklin Julie Ann
Home Financials for this Owner
Home Financials are based on the most recent Mortgage that was taken out on this home.
Original Mortgage
$71,872
Interest Rate
6.2%
Mortgage Type
FHA
Create a Home Valuation Report for This Property
The Home Valuation Report is an in-depth analysis detailing your home's value as well as a comparison with similar homes in the area
Home Values in the Area
Average Home Value in this Area
Purchase History
| Date | Buyer | Sale Price | Title Company |
|---|---|---|---|
| Price Michael D | -- | Title365 | |
| Price Michael D | $195,000 | Boston National Title | |
| Franklin Julie Ann | -- | Stewart Title |
Source: Public Records
Mortgage History
| Date | Status | Borrower | Loan Amount |
|---|---|---|---|
| Open | Price Michael D | $252,000 | |
| Previous Owner | Price Michael D | $195,000 | |
| Previous Owner | Franklin Julie Ann | $71,872 |
Source: Public Records
Tax History Compared to Growth
Tax History
| Year | Tax Paid | Tax Assessment Tax Assessment Total Assessment is a certain percentage of the fair market value that is determined by local assessors to be the total taxable value of land and additions on the property. | Land | Improvement |
|---|---|---|---|---|
| 2025 | $1,519 | $170,100 | $42,000 | $128,100 |
| 2024 | $1,519 | $162,000 | $42,000 | $120,000 |
| 2023 | $1,285 | $139,600 | $42,000 | $97,600 |
| 2022 | $1,260 | $128,600 | $35,000 | $93,600 |
| 2021 | $1,212 | $120,900 | $35,000 | $85,900 |
| 2020 | $739 | $90,200 | $24,200 | $66,000 |
| 2019 | $623 | $83,300 | $18,400 | $64,900 |
| 2018 | $600 | $81,600 | $15,600 | $66,000 |
| 2017 | $590 | $80,600 | $15,600 | $65,000 |
| 2016 | $512 | $77,700 | $15,600 | $62,100 |
| 2014 | $514 | $74,000 | $15,800 | $58,200 |
| 2013 | $514 | $74,900 | $15,300 | $59,600 |
Source: Public Records
Map
Nearby Homes
- 6540 N Us Highway 31
- 57 Oakden Ct
- 53 Oakden Ct
- 256 Bittersweet Dr
- 1041 Mount Olive Rd
- 190 Tracy Ridge Blvd
- 559 Genisis Dr
- 1119 Chateaugay Ct
- 106 Tracy Ridge Blvd
- 638 Harvest Meadow Way
- 840 Sweetbriar Ave
- 821 Princeton Dr
- 50 Meadow Creek Blvd
- 250 Southlane Dr
- 2525 Summerwood Ln
- 111 Meadow Creek Blvd
- 2350 Harvest Moon Dr
- 2777 Herndon Ln
- Aspen Plan at Lincoln Place
- Broadmoor Plan at Lincoln Place
- 286 Bittersweet Dr
- 1133 Warwick Rd
- 288 Bittersweet Dr
- 1131 Warwick Rd
- 285 Bittersweet Dr
- 1129 Warwick Rd
- 1127 Ashland Ave
- 290 Bittersweet Dr
- 1128 Warwick Dr
- 1128 Warwick Rd
- 70 Oakden Ct
- 1127 Warwick Rd
- 292 Bittersweet Dr
- 1125 Ashland Ave
- 1126 Warwick Rd
- 1128 Ashland Ave
- 68 Oakden Ct
- 72 Oakden Ct
- 1125 Warwick Rd
- 1123 Ashland Ave