Estimated Value: $230,667 - $256,000
--
Bed
--
Bath
1,144
Sq Ft
$216/Sq Ft
Est. Value
About This Home
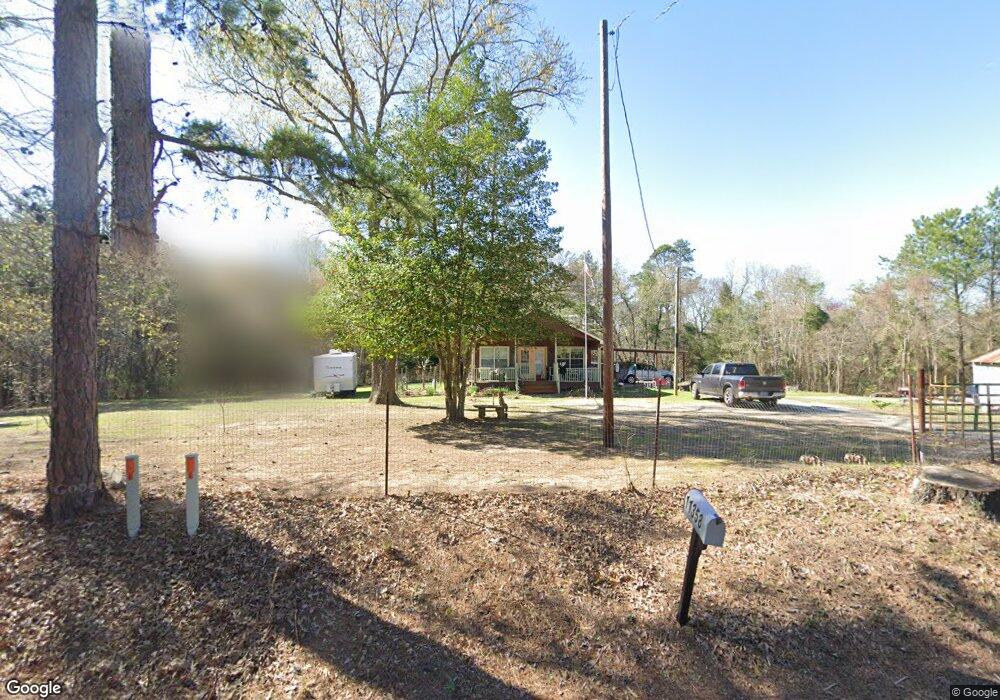
This home is located at 11358 County Road 246 S, Tyler, TX 75705 and is currently estimated at $246,917, approximately $215 per square foot. 11358 County Road 246 S is a home with nearby schools including Arp Elementary School, Arp Junior High School, and Arp High School.
Ownership History
Date
Name
Owned For
Owner Type
Purchase Details
Closed on
Nov 5, 2021
Sold by
Martin Karen Diana and Martin Ronny
Bought by
Bienek Lloyd and Bienek Julia
Current Estimated Value
Home Financials for this Owner
Home Financials are based on the most recent Mortgage that was taken out on this home.
Original Mortgage
$199,900
Outstanding Balance
$182,109
Interest Rate
2.88%
Mortgage Type
VA
Estimated Equity
$64,808
Purchase Details
Closed on
Nov 3, 2016
Sold by
Davis Jerry Max
Bought by
Davis Karen Diana
Purchase Details
Closed on
May 3, 2016
Sold by
Carr Iris N and Iverson Iris N
Bought by
Davis Karen
Purchase Details
Closed on
Jul 22, 2014
Sold by
Archer Wonita A and Archer Cherie B
Bought by
United Bilt Homes Llc
Purchase Details
Closed on
Jun 28, 2010
Sold by
Burnett Laura
Bought by
Archer Wonita
Purchase Details
Closed on
Oct 30, 2007
Sold by
Burrow Daniel and Teichler April
Bought by
Burnett Laura
Create a Home Valuation Report for This Property
The Home Valuation Report is an in-depth analysis detailing your home's value as well as a comparison with similar homes in the area
Home Values in the Area
Average Home Value in this Area
Purchase History
| Date | Buyer | Sale Price | Title Company |
|---|---|---|---|
| Bienek Lloyd | -- | Atc | |
| Davis Karen Diana | -- | None Available | |
| Davis Karen | -- | None Available | |
| United Bilt Homes Llc | -- | None Available | |
| Archer Wonita | -- | None Available | |
| Archer Wonita | -- | None Available | |
| Burnett Laura | -- | None Available | |
| Burnett Laura | -- | None Available |
Source: Public Records
Mortgage History
| Date | Status | Borrower | Loan Amount |
|---|---|---|---|
| Open | Bienek Lloyd | $199,900 |
Source: Public Records
Tax History Compared to Growth
Tax History
| Year | Tax Paid | Tax Assessment Tax Assessment Total Assessment is a certain percentage of the fair market value that is determined by local assessors to be the total taxable value of land and additions on the property. | Land | Improvement |
|---|---|---|---|---|
| 2025 | -- | $185,812 | $32,916 | $152,896 |
| 2024 | -- | $172,239 | $17,539 | $154,700 |
| 2023 | $3,408 | $248,492 | $17,539 | $230,953 |
| 2022 | $3,428 | $204,845 | $17,539 | $187,306 |
| 2021 | $2,750 | $153,391 | $17,523 | $135,868 |
| 2020 | $2,556 | $153,487 | $17,523 | $135,964 |
| 2019 | $2,392 | $126,434 | $17,523 | $108,911 |
| 2018 | $2,201 | $116,796 | $12,747 | $104,049 |
| 2017 | $2,192 | $116,902 | $12,747 | $104,155 |
| 2016 | $1,724 | $91,966 | $9,805 | $82,161 |
| 2015 | $1,390 | $111,545 | $9,805 | $101,740 |
| 2014 | $1,390 | $110,440 | $12,244 | $98,196 |
Source: Public Records
Map
Nearby Homes
- 20538 Wild Arrow Ct
- 20527 Wild Arrow Ct
- 20543 Wild Arrow Ct
- 20526 Wild Arrow Ct
- 0 Farm To Market Road 850
- 00 Cherokee St
- 7211 County Road 235
- 7211 - D County Road 235
- 7211-P County Road 235
- 16994 C R 223
- TBD Cr 224 (Lot 2a)
- TBD Cr 224 (Lot 2b)
- Lot 1 County Road 223
- Lot 2 County Road 223
- Lot 3 County Road 223
- Lot 5 County Road 223
- Lot 4 County Road 223
- 6101 County Road 233
- 13529 County Road 2290
- 13488 County Road 2290
- 11357 County Rd 246 S
- 11039 County Road 246 S
- 10896 County Road 246 S
- 11618 County Road 246 S
- 11013 County Road 233
- 10821 County Road 246 S
- 10822 County Road 246 S
- 10808 County Road 246 S
- 21061 Apache Rd
- 10804 County Road 246 S
- 21398 Apache Rd
- 21281 Apache Rd
- 20407 Fm 850
- Lot 4 -00- Lot 4 -00- Cr 246 - S
- Lot 5 -00- Lot 5 -00- Cr 246 - S
- 20455 Fm 850
- 20555 Fm 850
- 20513 Farm To Market Road 850
- Lot 1 -00- Lot 1 -00- Cr 246 - S
- Lot 17 Apache Rd