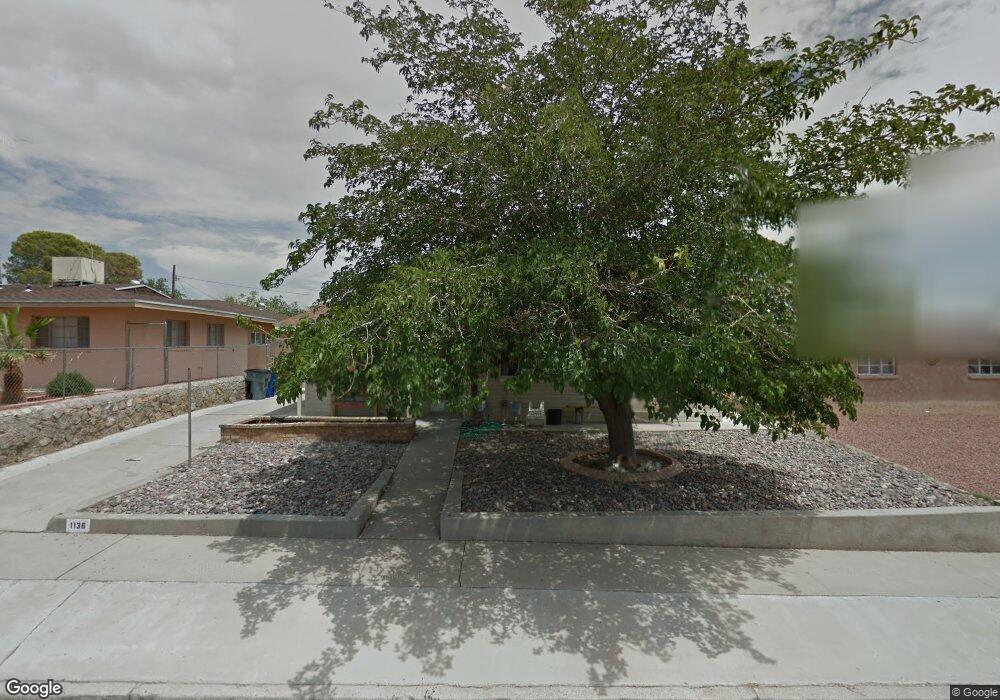
1136 Belen Rd El Paso, TX 79915
Ranchland East NeighborhoodEstimated Value: $131,000 - $145,411
--
Bed
1
Bath
957
Sq Ft
$144/Sq Ft
Est. Value
About This Home
This home is located at 1136 Belen Rd, El Paso, TX 79915 and is currently estimated at $137,353, approximately $143 per square foot. 1136 Belen Rd is a home located in El Paso County with nearby schools including Hacienda Heights Elementary School, North Loop Elementary School, and Bel Air Middle.
Ownership History
Date
Name
Owned For
Owner Type
Purchase Details
Closed on
Jun 8, 2023
Sold by
Deornelas Maria and Ornelas Maria D
Bought by
Thongjunthough Ida G Ornelas
Current Estimated Value
Purchase Details
Closed on
Jan 28, 2019
Sold by
Ornelas Maria De Los Angeles and Ornelas Maria D
Bought by
Amaya Olivia A and Amaya Octavio A
Purchase Details
Closed on
Apr 9, 2014
Sold by
Mares Anita
Bought by
Ornelas Thoghunthoug Ida G
Purchase Details
Closed on
Jan 16, 2001
Sold by
Ornelas Maria De Los Angeles and Ornelas Tomas A
Bought by
Ornelas Guadalupe A
Home Financials for this Owner
Home Financials are based on the most recent Mortgage that was taken out on this home.
Original Mortgage
$20,000
Interest Rate
7.04%
Mortgage Type
Credit Line Revolving
Create a Home Valuation Report for This Property
The Home Valuation Report is an in-depth analysis detailing your home's value as well as a comparison with similar homes in the area
Home Values in the Area
Average Home Value in this Area
Purchase History
| Date | Buyer | Sale Price | Title Company |
|---|---|---|---|
| Thongjunthough Ida G Ornelas | -- | None Listed On Document | |
| Amaya Olivia A | -- | None Available | |
| Amaya Olivia A | -- | None Available | |
| Ornelas Thoghunthoug Ida G | -- | None Available | |
| Ornelas Guadalupe A | -- | -- | |
| Ornelas Guadalupe A | -- | -- |
Source: Public Records
Mortgage History
| Date | Status | Borrower | Loan Amount |
|---|---|---|---|
| Previous Owner | Ornelas Guadalupe A | $20,000 |
Source: Public Records
Tax History Compared to Growth
Tax History
| Year | Tax Paid | Tax Assessment Tax Assessment Total Assessment is a certain percentage of the fair market value that is determined by local assessors to be the total taxable value of land and additions on the property. | Land | Improvement |
|---|---|---|---|---|
| 2025 | $3,305 | $141,018 | $36,293 | $104,725 |
| 2024 | $3,305 | $120,349 | $15,624 | $104,725 |
| 2023 | $3,305 | $98,097 | $0 | $0 |
| 2022 | $2,769 | $89,179 | $0 | $0 |
| 2021 | $2,635 | $81,072 | $15,624 | $65,448 |
| 2020 | $2,393 | $75,758 | $15,624 | $60,134 |
| 2018 | $2,379 | $76,515 | $15,624 | $60,891 |
| 2017 | $2,186 | $71,522 | $15,624 | $55,898 |
| 2016 | $2,186 | $71,522 | $15,624 | $55,898 |
| 2015 | $1,156 | $71,522 | $15,624 | $55,898 |
| 2014 | $1,156 | $72,467 | $15,624 | $56,843 |
Source: Public Records
Map
Nearby Homes
- 1121 Belen Rd
- 7564 Matamoros Dr
- 1124 Hunter Dr
- 7622 Matamoros Dr
- 7761 Maverick Ave
- 7534 Taxco Dr
- 1207 Bois d Arc Dr
- 7403 Mojave Dr
- 7713 Matamoros Dr
- 7718 Parral Dr
- 7315 Mojave Dr
- 7832 Ranchland Dr
- 7542 Hermosillo Dr
- 7921 Candlewood Ave
- 7936 Dogwood St
- 844 Santa Barbara Dr
- 10212 Garwood Ct
- 10412 Chinaberry Dr
- 812 Santa Barbara Dr
- 7655 Hacienda Ave