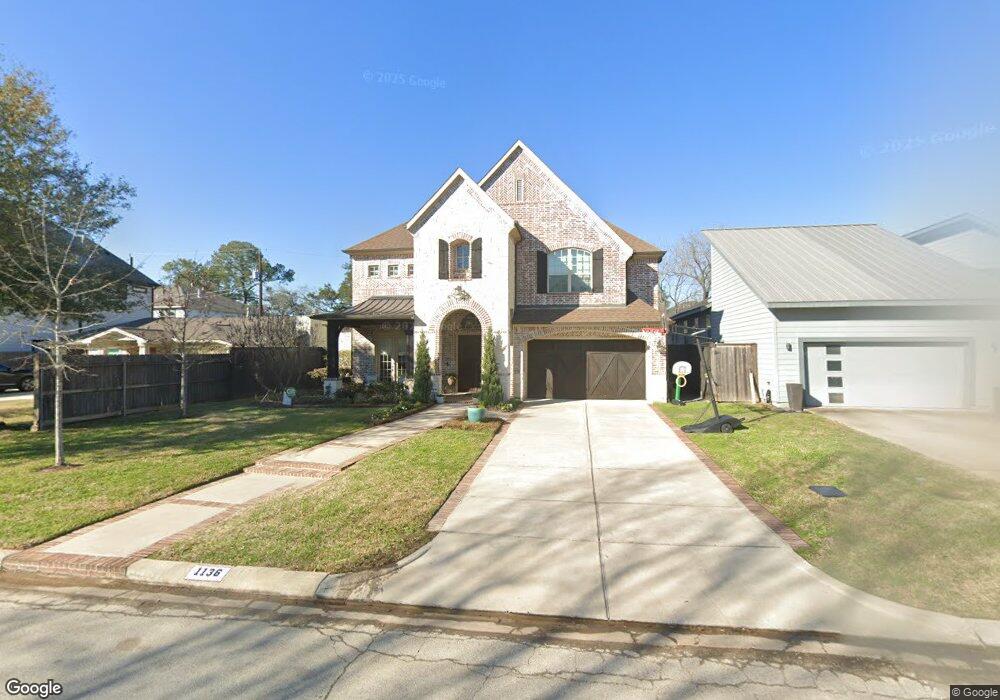
1136 Du Barry Ln Houston, TX 77018
Oak Forest-Garden Oaks NeighborhoodEstimated Value: $1,297,000 - $1,486,000
4
Beds
4
Baths
4,605
Sq Ft
$304/Sq Ft
Est. Value
About This Home
This home is located at 1136 Du Barry Ln, Houston, TX 77018 and is currently estimated at $1,399,049, approximately $303 per square foot. 1136 Du Barry Ln is a home located in Harris County with nearby schools including Garden Oaks Montessori, Frank Black Middle School, and Waltrip High School.
Ownership History
Date
Name
Owned For
Owner Type
Purchase Details
Closed on
Mar 12, 2015
Sold by
Quintessa Homes And Properties Lp
Bought by
Paisley Jeremy K and Paisley Deserea W
Current Estimated Value
Home Financials for this Owner
Home Financials are based on the most recent Mortgage that was taken out on this home.
Original Mortgage
$680,000
Outstanding Balance
$520,812
Interest Rate
3.68%
Mortgage Type
New Conventional
Estimated Equity
$878,237
Purchase Details
Closed on
Dec 16, 2013
Sold by
Jones Frank K and Jones Linda M
Bought by
Quintessa Homes & Properties Lp
Home Financials for this Owner
Home Financials are based on the most recent Mortgage that was taken out on this home.
Original Mortgage
$596,625
Interest Rate
4.21%
Mortgage Type
Purchase Money Mortgage
Create a Home Valuation Report for This Property
The Home Valuation Report is an in-depth analysis detailing your home's value as well as a comparison with similar homes in the area
Home Values in the Area
Average Home Value in this Area
Purchase History
| Date | Buyer | Sale Price | Title Company |
|---|---|---|---|
| Paisley Jeremy K | -- | Old Republic Natl Title Co | |
| Quintessa Homes & Properties Lp | -- | Old Republic National Title |
Source: Public Records
Mortgage History
| Date | Status | Borrower | Loan Amount |
|---|---|---|---|
| Open | Paisley Jeremy K | $680,000 | |
| Previous Owner | Quintessa Homes & Properties Lp | $596,625 |
Source: Public Records
Tax History Compared to Growth
Tax History
| Year | Tax Paid | Tax Assessment Tax Assessment Total Assessment is a certain percentage of the fair market value that is determined by local assessors to be the total taxable value of land and additions on the property. | Land | Improvement |
|---|---|---|---|---|
| 2025 | $22,162 | $1,285,331 | $503,250 | $782,081 |
| 2024 | $22,162 | $1,381,582 | $503,250 | $878,332 |
| 2023 | $22,162 | $1,290,000 | $503,250 | $786,750 |
| 2022 | $24,221 | $1,100,000 | $420,750 | $679,250 |
| 2021 | $24,150 | $1,036,200 | $404,250 | $631,950 |
| 2020 | $25,092 | $1,101,046 | $346,500 | $754,546 |
| 2019 | $23,837 | $942,000 | $346,500 | $595,500 |
| 2018 | $17,614 | $880,650 | $330,000 | $550,650 |
| 2017 | $22,268 | $880,650 | $330,000 | $550,650 |
| 2016 | $22,268 | $880,650 | $330,000 | $550,650 |
| 2015 | $7,398 | $880,650 | $330,000 | $550,650 |
| 2014 | $7,398 | $287,779 | $264,000 | $23,779 |
Source: Public Records
Map
Nearby Homes
- 3720 Ella Blvd
- 1148 Du Barry Ln
- 1112 Kinley Ln
- 1226 Chippendale Rd
- 1115 Du Barry Ln
- 1226 Du Barry Ln
- 3527 Ella Blvd
- 1025 Wakefield Dr
- 1249 Chippendale Rd
- 1021 Wakefield Dr
- 1032 W 41st St
- 1225 Althea Dr
- 1030 W 41st St
- 1261 Wakefield Dr
- 1261 Du Barry Ln
- 1237 Althea Dr
- 1003 Wakefield Dr
- 4105 Ella Blvd
- 1050 W 42nd St
- 1249 Gardenia Dr
- 1132 Du Barry Ln
- 1140 Du Barry Ln
- 3734 Ella Blvd
- 1128 Du Barry Ln
- 3716 Ella Blvd
- 1144 Du Barry Ln
- 3710 Ella Blvd
- 1111 Wakefield Dr
- 1124 Du Barry Ln
- 1115 Wakefield Dr
- 1107 Wakefield Dr
- 1135 Du Barry Ln
- 3724 Ella Blvd
- 1139 Du Barry Ln
- 1131 Du Barry Ln
- 1103 Wakefield Dr
- 1119 Wakefield Dr
- 1143 Du Barry Ln
- 1127 Du Barry Ln
- 1147 Du Barry Ln