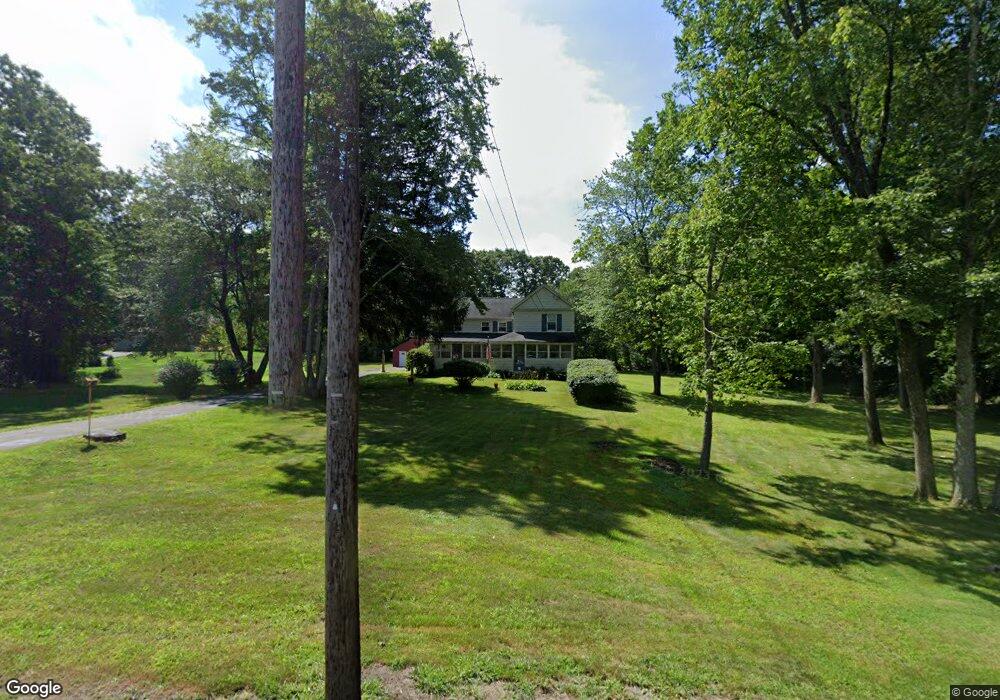
1136 East St Ludlow, MA 01056
Estimated Value: $368,335 - $429,000
4
Beds
2
Baths
1,976
Sq Ft
$202/Sq Ft
Est. Value
About This Home
This home is located at 1136 East St, Ludlow, MA 01056 and is currently estimated at $400,084, approximately $202 per square foot. 1136 East St is a home located in Hampden County with nearby schools including East Street Elementary School, Chapin Street Elementary School, and Paul R. Baird Middle School.
Ownership History
Date
Name
Owned For
Owner Type
Purchase Details
Closed on
Oct 31, 2001
Sold by
Crafts Robert R
Bought by
Hillman Russell J and Pauze Nancy R
Current Estimated Value
Home Financials for this Owner
Home Financials are based on the most recent Mortgage that was taken out on this home.
Original Mortgage
$60,000
Outstanding Balance
$23,624
Interest Rate
6.82%
Mortgage Type
Purchase Money Mortgage
Estimated Equity
$376,460
Create a Home Valuation Report for This Property
The Home Valuation Report is an in-depth analysis detailing your home's value as well as a comparison with similar homes in the area
Home Values in the Area
Average Home Value in this Area
Purchase History
| Date | Buyer | Sale Price | Title Company |
|---|---|---|---|
| Hillman Russell J | $160,000 | -- |
Source: Public Records
Mortgage History
| Date | Status | Borrower | Loan Amount |
|---|---|---|---|
| Open | Hillman Russell J | $15,000 | |
| Open | Hillman Russell J | $60,000 | |
| Previous Owner | Hillman Russell J | $50,000 |
Source: Public Records
Tax History Compared to Growth
Tax History
| Year | Tax Paid | Tax Assessment Tax Assessment Total Assessment is a certain percentage of the fair market value that is determined by local assessors to be the total taxable value of land and additions on the property. | Land | Improvement |
|---|---|---|---|---|
| 2025 | $5,151 | $296,900 | $86,100 | $210,800 |
| 2024 | $4,975 | $275,000 | $86,100 | $188,900 |
| 2023 | $4,854 | $248,800 | $71,600 | $177,200 |
| 2022 | $4,798 | $240,000 | $71,600 | $168,400 |
| 2021 | $4,680 | $222,000 | $71,600 | $150,400 |
| 2020 | $4,479 | $217,200 | $70,500 | $146,700 |
| 2019 | $4,222 | $213,000 | $69,800 | $143,200 |
| 2018 | $4,047 | $212,900 | $69,800 | $143,100 |
| 2017 | $3,967 | $214,100 | $71,300 | $142,800 |
| 2016 | $3,992 | $220,200 | $82,200 | $138,000 |
| 2015 | $3,747 | $216,700 | $81,400 | $135,300 |
Source: Public Records
Map
Nearby Homes
- 1172 East St
- 143 James St
- Lot 28 Tower Rd
- 235 James St
- 229 Miller St Unit F-13
- 229 Miller St Unit C-1
- 229 Miller St Unit B2
- 308 Miller St Unit 72
- 308 Miller St Unit 79
- 308 Miller St Unit 78
- 22 Balsam Hill Rd
- 319 Ventura St
- 88-90 Miller St
- 425 Miller St
- 38 King Dr
- 51 Newcrest St
- 138 Ridgeview Cir
- 225 Maynard Rd
- 182 Mountain Rd
- 4 Hillcrest Dr