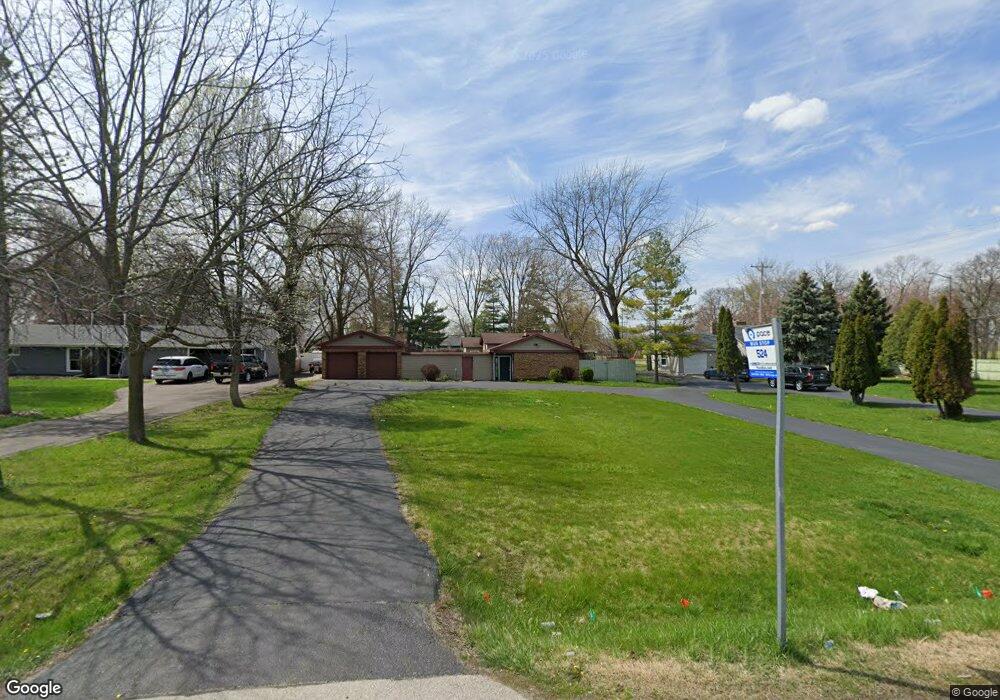
1136 N Randall Rd Aurora, IL 60506
Edgelawn Randall NeighborhoodEstimated Value: $290,000 - $349,000
3
Beds
2
Baths
1,822
Sq Ft
$181/Sq Ft
Est. Value
About This Home
This home is located at 1136 N Randall Rd, Aurora, IL 60506 and is currently estimated at $329,080, approximately $180 per square foot. 1136 N Randall Rd is a home located in Kane County with nearby schools including Fearn Elementary School, Jewel Middle School, and West Aurora High School.
Ownership History
Date
Name
Owned For
Owner Type
Purchase Details
Closed on
Jun 2, 2010
Sold by
Hsbc Bank Usa National Association
Bought by
Nomaan Llc
Current Estimated Value
Purchase Details
Closed on
Oct 30, 2009
Sold by
Lara Mauricio
Bought by
Hsbc Bank Usa National Association
Purchase Details
Closed on
Jun 6, 2006
Sold by
Sleem Hatem and Sleem Johana
Bought by
Lara Mauricio
Home Financials for this Owner
Home Financials are based on the most recent Mortgage that was taken out on this home.
Original Mortgage
$200,000
Interest Rate
8.62%
Mortgage Type
Purchase Money Mortgage
Purchase Details
Closed on
Mar 31, 1995
Sold by
Draus James M and Draus Julie L
Bought by
Sleem Hatem and Sleem Johana
Home Financials for this Owner
Home Financials are based on the most recent Mortgage that was taken out on this home.
Original Mortgage
$135,850
Interest Rate
8.91%
Create a Home Valuation Report for This Property
The Home Valuation Report is an in-depth analysis detailing your home's value as well as a comparison with similar homes in the area
Home Values in the Area
Average Home Value in this Area
Purchase History
| Date | Buyer | Sale Price | Title Company |
|---|---|---|---|
| Nomaan Llc | $105,000 | Ticor Title Insurance Co | |
| Hsbc Bank Usa National Association | -- | None Available | |
| Lara Mauricio | $250,000 | Law Title Insurance | |
| Sleem Hatem | $143,000 | First American Title Ins Co |
Source: Public Records
Mortgage History
| Date | Status | Borrower | Loan Amount |
|---|---|---|---|
| Previous Owner | Lara Mauricio | $200,000 | |
| Previous Owner | Sleem Hatem | $135,850 |
Source: Public Records
Tax History Compared to Growth
Tax History
| Year | Tax Paid | Tax Assessment Tax Assessment Total Assessment is a certain percentage of the fair market value that is determined by local assessors to be the total taxable value of land and additions on the property. | Land | Improvement |
|---|---|---|---|---|
| 2024 | $7,654 | $96,669 | $13,524 | $83,145 |
| 2023 | $7,398 | $86,374 | $12,084 | $74,290 |
| 2022 | $6,976 | $78,809 | $11,026 | $67,783 |
| 2021 | $6,704 | $73,372 | $10,265 | $63,107 |
| 2020 | $6,762 | $72,232 | $9,535 | $62,697 |
| 2019 | $6,544 | $66,924 | $8,834 | $58,090 |
| 2018 | $6,108 | $61,185 | $8,171 | $53,014 |
| 2017 | $6,190 | $60,145 | $8,858 | $51,287 |
| 2016 | $6,385 | $60,104 | $7,593 | $52,511 |
| 2015 | -- | $61,492 | $6,529 | $54,963 |
| 2014 | -- | $57,630 | $6,279 | $51,351 |
| 2013 | -- | $56,810 | $6,190 | $50,620 |
Source: Public Records
Map
Nearby Homes
- 1035 Newcastle Ln
- 972 Westgate Dr
- 1532 Golden Oaks Pkwy
- 833 N Randall Rd Unit C4
- 967 Sapphire Ln
- 959 Sapphire Ln
- 963 Sapphire Ln
- 1389 Monomoy St Unit B2
- 960 Sapphire Ln
- 964 Sapphire Ln
- 1351 Monomoy St Unit D
- 1120 Emerald Dr
- 910 Southbridge Dr
- 1815 Brighton Cir
- 1104 New Haven Ave
- 795 N Elmwood Dr
- 1475 Elder Dr
- 781 N Elmwood Dr
- 1513 Elder Dr
- 616 Morton Ave
- 1142 N Randall Rd
- 1124 N Randall Rd
- 1118 N Randall Rd
- 1112 N Randall Rd
- 1212 N Randall Rd
- 1095 Newcastle Ln
- 1106 N Randall Rd
- 1418 Cottonwood Dr
- 1097 Newcastle Ln
- 1410 Cottonwood Dr
- 1099 Newcastle Ln
- 1093 Newcastle Ln
- 1100 N Randall Rd
- 1402 Cottonwood Dr
- 1105 Newcastle Ln
- 1419 Cottonwood Dr
- 1224 N Randall Rd
- 1091 Newcastle Ln Unit 1
- 1125 Newcastle Ln
- 1394 Cottonwood Dr