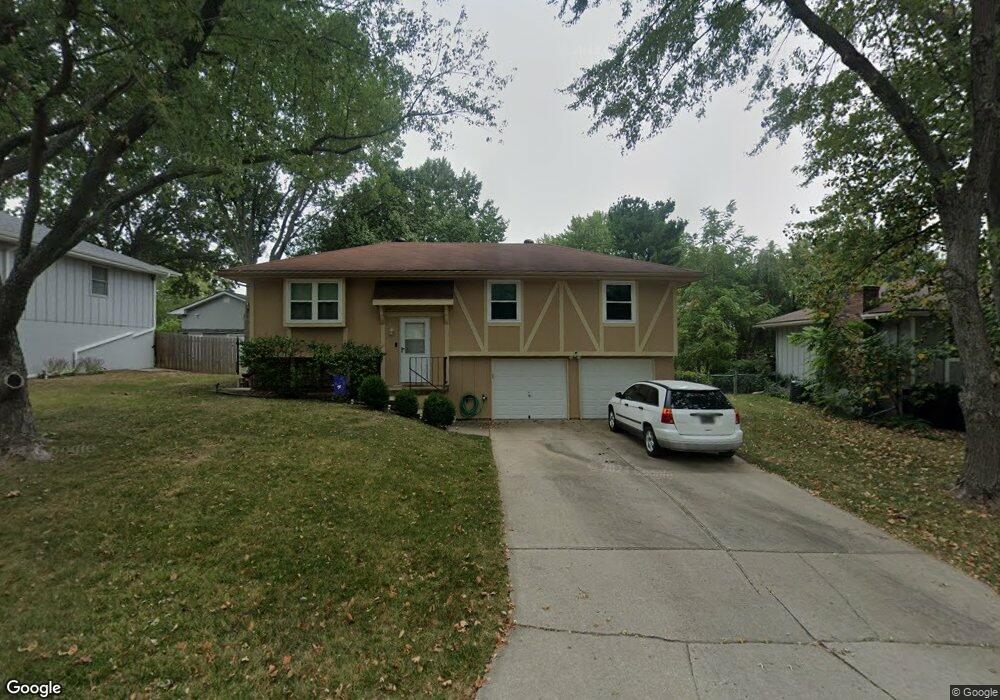
1136 NE 9th Street Terrace Blue Springs, MO 64014
Estimated Value: $222,000 - $261,000
3
Beds
1
Bath
1,080
Sq Ft
$224/Sq Ft
Est. Value
About This Home
This home is located at 1136 NE 9th Street Terrace, Blue Springs, MO 64014 and is currently estimated at $242,353, approximately $224 per square foot. 1136 NE 9th Street Terrace is a home located in Jackson County with nearby schools including James Walker Elementary School, Brittany Hill Middle School, and Blue Springs High School.
Ownership History
Date
Name
Owned For
Owner Type
Purchase Details
Closed on
Nov 26, 2002
Sold by
Dye Charles H and Dye Terri A
Bought by
Scherer Matt C and Johnston Tara L
Current Estimated Value
Home Financials for this Owner
Home Financials are based on the most recent Mortgage that was taken out on this home.
Original Mortgage
$103,415
Outstanding Balance
$43,666
Interest Rate
6.13%
Mortgage Type
FHA
Estimated Equity
$198,687
Purchase Details
Closed on
Nov 21, 2002
Sold by
Hedrick Theodore D and Hedrick April D
Bought by
Dye Charles H and Dye Terri A
Home Financials for this Owner
Home Financials are based on the most recent Mortgage that was taken out on this home.
Original Mortgage
$103,415
Outstanding Balance
$43,666
Interest Rate
6.13%
Mortgage Type
FHA
Estimated Equity
$198,687
Purchase Details
Closed on
Jan 24, 1997
Sold by
Hedrick Carla Christine
Bought by
Hedrick Theodore Daniel
Create a Home Valuation Report for This Property
The Home Valuation Report is an in-depth analysis detailing your home's value as well as a comparison with similar homes in the area
Home Values in the Area
Average Home Value in this Area
Purchase History
| Date | Buyer | Sale Price | Title Company |
|---|---|---|---|
| Scherer Matt C | -- | Old Republic Title | |
| Dye Charles H | -- | Old Republic Title | |
| Hedrick Theodore Daniel | -- | Old Republic Title Co Of Ks |
Source: Public Records
Mortgage History
| Date | Status | Borrower | Loan Amount |
|---|---|---|---|
| Open | Scherer Matt C | $103,415 |
Source: Public Records
Tax History Compared to Growth
Tax History
| Year | Tax Paid | Tax Assessment Tax Assessment Total Assessment is a certain percentage of the fair market value that is determined by local assessors to be the total taxable value of land and additions on the property. | Land | Improvement |
|---|---|---|---|---|
| 2025 | $2,790 | $30,905 | $6,857 | $24,048 |
| 2024 | $2,790 | $34,200 | $5,480 | $28,720 |
| 2023 | $2,737 | $34,200 | $5,480 | $28,720 |
| 2022 | $2,116 | $23,370 | $6,080 | $17,290 |
| 2021 | $2,114 | $23,370 | $6,080 | $17,290 |
| 2020 | $1,977 | $22,233 | $6,080 | $16,153 |
| 2019 | $1,911 | $22,233 | $6,080 | $16,153 |
| 2018 | $1,847 | $20,683 | $4,123 | $16,560 |
| 2017 | $1,836 | $20,683 | $4,123 | $16,560 |
| 2016 | $1,836 | $20,615 | $3,344 | $17,271 |
| 2014 | $1,748 | $19,557 | $3,333 | $16,224 |
Source: Public Records
Map
Nearby Homes
- 1136 NE 10th St
- 705 NE Locust Dr
- 1001 NE Wien Ave
- 2012 NE Adams Dairy Rd
- 1800 NE Waterfield Village Ct
- 420 NE Golfview Dr
- 0 NE Jefferson St
- 2401 NE Coronado Dr
- 816 NE Mary Ct
- 1200 NE Crestview Dr
- 458 NE Coronado Dr
- 517 NE Johnston Dr
- 1855 NE Duncan Rd
- 311 NE Bridge Place
- 1200 NE Hilltop Dr
- 404 NE Lee Dr
- 204 NW Golfview Dr
- 2400 NE Porter Rd
- 408 NE 6th St Unit C
- 0 NW Jefferson St
- 1132 NE 9th Street Terrace
- 1140 NE 9th Street Terrace
- 1140 NE 9th St
- 1128 NE 9th Street Terrace
- 1135 NE 9th Street Terrace
- 1137 NE 10th St
- 1144 NE 9th Street Terrace
- 1133 NE 10th St
- 1131 NE 9th Street Terrace
- 1129 NE 10th St
- 1127 NE 9th Street Terrace
- 1141 NE 10th St
- 1125 NE 10th St
- 1139 NE 9th Street Terrace
- 1124 NE 9th Street Terrace
- 1148 NE 9th Street Terrace
- 1121 NE 10th St
- 1123 NE 9th Street Terrace
- 1145 NE 10th St
- 1146 NE 9th St