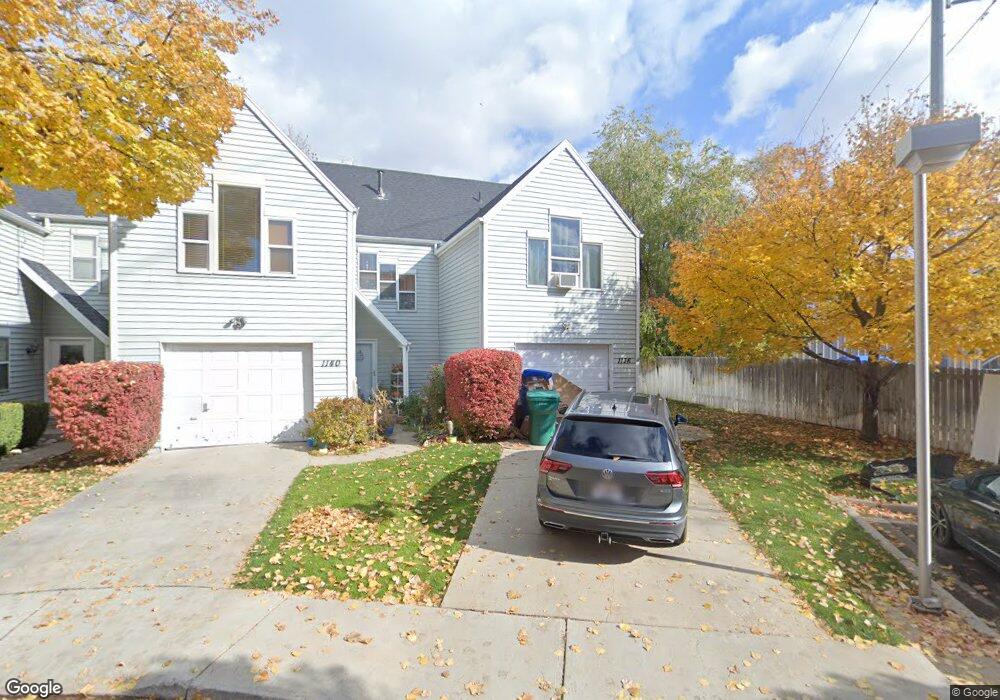
1136 Regent Ct Unit 17 Orem, UT 84057
Bonneville NeighborhoodEstimated Value: $333,000 - $376,107
4
Beds
3
Baths
1,950
Sq Ft
$185/Sq Ft
Est. Value
About This Home
This home is located at 1136 Regent Ct Unit 17, Orem, UT 84057 and is currently estimated at $361,527, approximately $185 per square foot. 1136 Regent Ct Unit 17 is a home located in Utah County with nearby schools including Bonneville Elementary School, Orem Junior High School, and Timpanogos High School.
Ownership History
Date
Name
Owned For
Owner Type
Purchase Details
Closed on
Oct 14, 2025
Sold by
Sly Toni
Bought by
Smith Kimble
Current Estimated Value
Home Financials for this Owner
Home Financials are based on the most recent Mortgage that was taken out on this home.
Original Mortgage
$250,242
Outstanding Balance
$250,242
Interest Rate
6.5%
Mortgage Type
FHA
Estimated Equity
$111,285
Purchase Details
Closed on
Feb 7, 2006
Sold by
Enkhbat Ganaa
Bought by
Sly Toni
Purchase Details
Closed on
May 1, 2002
Sold by
Loveall Cheryl
Bought by
Enkhbat Bataa and Enkhbat Ganaa
Purchase Details
Closed on
Apr 22, 1997
Sold by
Jensen Gary Oleen
Bought by
Loveall Cheryl
Home Financials for this Owner
Home Financials are based on the most recent Mortgage that was taken out on this home.
Original Mortgage
$99,900
Interest Rate
7.86%
Create a Home Valuation Report for This Property
The Home Valuation Report is an in-depth analysis detailing your home's value as well as a comparison with similar homes in the area
Home Values in the Area
Average Home Value in this Area
Purchase History
| Date | Buyer | Sale Price | Title Company |
|---|---|---|---|
| Smith Kimble | -- | Fidelity National Title | |
| Sly Toni | -- | Inwest Title Services Inc | |
| Enkhbat Bataa | -- | Sundance Title Ins Agency | |
| Loveall Cheryl | -- | -- |
Source: Public Records
Mortgage History
| Date | Status | Borrower | Loan Amount |
|---|---|---|---|
| Open | Smith Kimble | $250,242 | |
| Previous Owner | Loveall Cheryl | $99,900 |
Source: Public Records
Tax History Compared to Growth
Tax History
| Year | Tax Paid | Tax Assessment Tax Assessment Total Assessment is a certain percentage of the fair market value that is determined by local assessors to be the total taxable value of land and additions on the property. | Land | Improvement |
|---|---|---|---|---|
| 2025 | $1,559 | $194,975 | $52,100 | $302,400 |
| 2024 | $1,559 | $190,630 | $0 | $0 |
| 2023 | $1,408 | $185,020 | $0 | $0 |
| 2022 | $1,386 | $176,495 | $0 | $0 |
| 2021 | $1,305 | $251,700 | $30,200 | $221,500 |
| 2020 | $1,186 | $224,700 | $27,000 | $197,700 |
| 2019 | $1,096 | $216,000 | $24,000 | $192,000 |
| 2018 | $1,052 | $198,200 | $24,000 | $174,200 |
| 2017 | $936 | $94,380 | $0 | $0 |
| 2016 | $922 | $85,800 | $0 | $0 |
| 2015 | $938 | $82,500 | $0 | $0 |
| 2014 | $798 | $69,905 | $0 | $0 |
Source: Public Records
Map
Nearby Homes
- 545 W 1240 N
- 582 W 1300 N
- 597 W 1400 N
- 332 W Amiron Way Unit D
- 1455 N Amiron Way Unit A
- 1050 N 100 W
- 1060 N 100 W
- 145 W 905 N
- 417 W 750 N
- 125 W 870 N
- 947 N 830 W
- 677 N Orem Blvd Unit 28
- 613 W 1550 N
- 1527 N 275 St W Unit 4
- 1543 N 275 St W Unit 2
- 1531 N 275 St W Unit 3
- 1570 N 275 St W
- 1557 N 275 St W Unit 1
- 1542 N 275 St W Unit 5
- 1556 N 275 St W Unit 5
- 1136 Regent Ct
- 1140 Regent Ct
- 1142 Regent Ct Unit 15
- 1150 Regent Ct Unit 13
- 442 W 1100 N
- 1152 Regent Ct
- 436 W 1100 N
- 1156 Regent Ct
- 1156 Regent Ct Unit 11
- 452 W 1100 N
- 1151 Regent Ct
- 1160 Regent Ct
- 1160 Regent Ct
- 417 W 1100 N
- 409 W 1100 N
- 401 W 1100 N
- 435 W 1100 N
- 423 W 1100 N
- 407 W 1100 N
- 1170 Regent Ct