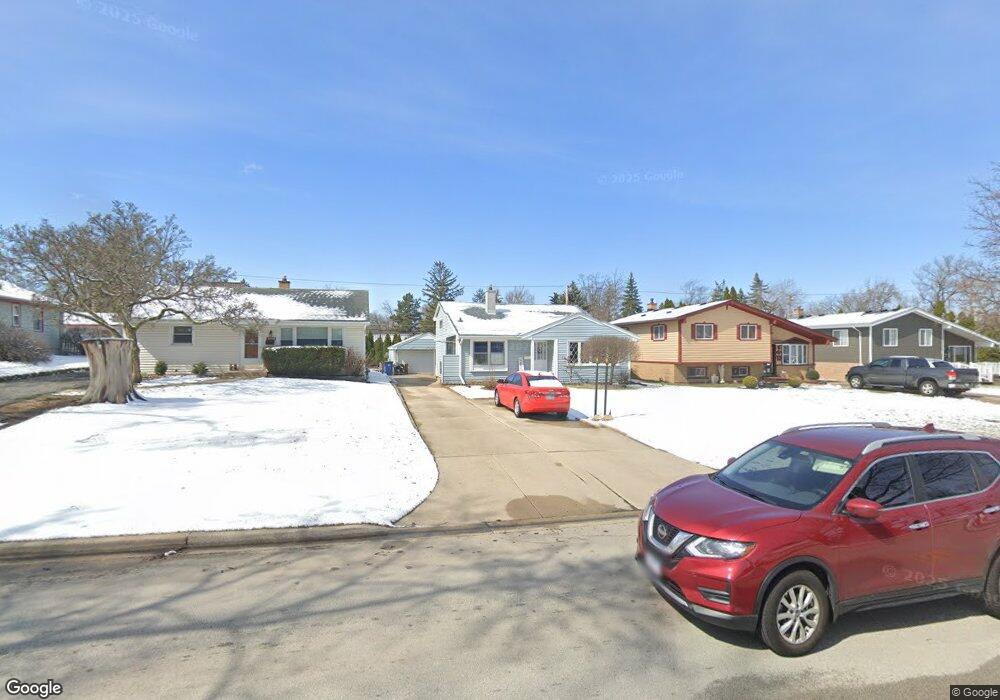
1136 S Summit Ave Villa Park, IL 60181
Estimated Value: $336,000 - $400,000
2
Beds
2
Baths
904
Sq Ft
$392/Sq Ft
Est. Value
About This Home
This home is located at 1136 S Summit Ave, Villa Park, IL 60181 and is currently estimated at $354,341, approximately $391 per square foot. 1136 S Summit Ave is a home located in DuPage County with nearby schools including Salt Creek Elementary School, John E Albright Middle School, and Stella May Swartz Elementary School.
Ownership History
Date
Name
Owned For
Owner Type
Purchase Details
Closed on
May 18, 2017
Sold by
Chcago Title Land Trust Co
Bought by
Stuckenberg Jacob and Stuckenberg Marcy
Current Estimated Value
Home Financials for this Owner
Home Financials are based on the most recent Mortgage that was taken out on this home.
Original Mortgage
$195,937
Outstanding Balance
$162,632
Interest Rate
4.03%
Mortgage Type
New Conventional
Estimated Equity
$191,709
Purchase Details
Closed on
Jul 14, 2005
Sold by
Luban Patricia A and Sanborn Donald M
Bought by
Chicago Title Land Trust Co and Trust #8002345217
Purchase Details
Closed on
Nov 19, 1999
Sold by
Rutkowski Thaddeus and Rutkowski Beverly
Bought by
Luban Patricia Ann and Sanborn Donald Maurice
Home Financials for this Owner
Home Financials are based on the most recent Mortgage that was taken out on this home.
Original Mortgage
$138,150
Interest Rate
7.87%
Mortgage Type
FHA
Create a Home Valuation Report for This Property
The Home Valuation Report is an in-depth analysis detailing your home's value as well as a comparison with similar homes in the area
Home Values in the Area
Average Home Value in this Area
Purchase History
| Date | Buyer | Sale Price | Title Company |
|---|---|---|---|
| Stuckenberg Jacob | -- | None Available | |
| Chicago Title Land Trust Co | -- | Chicago Title Land Trust Co | |
| Luban Patricia Ann | $140,500 | -- |
Source: Public Records
Mortgage History
| Date | Status | Borrower | Loan Amount |
|---|---|---|---|
| Open | Stuckenberg Jacob | $195,937 | |
| Previous Owner | Luban Patricia Ann | $138,150 |
Source: Public Records
Tax History Compared to Growth
Tax History
| Year | Tax Paid | Tax Assessment Tax Assessment Total Assessment is a certain percentage of the fair market value that is determined by local assessors to be the total taxable value of land and additions on the property. | Land | Improvement |
|---|---|---|---|---|
| 2024 | $4,437 | $83,906 | $23,034 | $60,872 |
| 2023 | $3,956 | $77,590 | $21,300 | $56,290 |
| 2022 | $3,866 | $74,590 | $20,480 | $54,110 |
| 2021 | $3,848 | $72,730 | $19,970 | $52,760 |
| 2020 | $3,764 | $71,130 | $19,530 | $51,600 |
| 2019 | $3,565 | $67,630 | $18,570 | $49,060 |
| 2018 | $3,288 | $59,830 | $16,430 | $43,400 |
| 2017 | $3,210 | $57,020 | $15,660 | $41,360 |
| 2016 | $2,953 | $53,710 | $14,750 | $38,960 |
| 2015 | $2,899 | $50,040 | $13,740 | $36,300 |
| 2014 | $3,589 | $59,910 | $27,930 | $31,980 |
| 2013 | $3,366 | $60,750 | $28,320 | $32,430 |
Source: Public Records
Map
Nearby Homes
- 2 Ardmore Ave
- 0S639 Summit Ave
- 818 S Villa Ave
- 1500 S Ardmore Ave Unit 408
- 625 E Van Buren St
- 650 E Van Buren St
- 1046 E Van Buren St
- 928 S Michigan Ave
- 727 S Oakland Ave
- 613 S Summit Ave
- 851 Addison Ave
- 604 S Grant Ave
- 5 E Washington St
- 639 S Oakland Ave
- 835 S Wisconsin Ave
- 326 W Adams St
- 412 E Washington St
- 1S134 Holyoke Ln Unit G
- 633 S Monterey Ave
- 1S122 Stratford Ln Unit 3
- 1132 S Summit Ave
- 1140 S Summit Ave
- 1128 S Summit Ave
- 1144 S Summit Ave
- 134 E Harrison St
- 133 Congress St
- 130 E Harrison St
- 143 Congress St
- 1135 S Summit Ave
- 1131 S Summit Ave
- 1139 S Summit Ave
- 129 Congress St
- 125 Congress St
- 1143 S Summit Ave
- 1129 S Summit Ave
- 1141 S Cornell Ave
- 1121 S Cornell Ave
- 1127 S Summit Ave
- 1210 S Summit Ave
- 144 Congress St