Estimated Value: $354,000 - $398,000
4
Beds
1
Bath
1,760
Sq Ft
$209/Sq Ft
Est. Value
About This Home
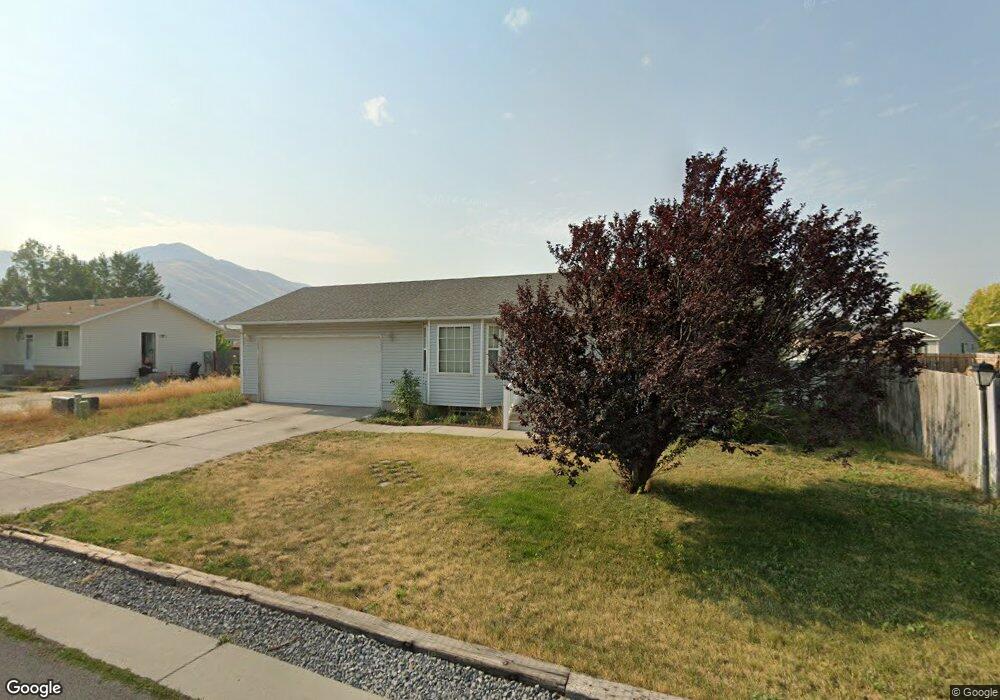
This home is located at 1136 Tule Dr, Hyrum, UT 84319 and is currently estimated at $368,441, approximately $209 per square foot. 1136 Tule Dr is a home located in Cache County with nearby schools including Canyon School, South Cache Middle School, and Mountain Crest High School.
Ownership History
Date
Name
Owned For
Owner Type
Purchase Details
Closed on
Mar 24, 2025
Sold by
Mark Leon Moore Living Trust and Susan Jensen Moore Living Trust
Bought by
Bishop Chelsey and Bishop Andrew Don
Current Estimated Value
Purchase Details
Closed on
Nov 29, 2012
Sold by
Moore Mark L and Moore Susanne
Bought by
Moore Mark Leon and Moore Susanne Jensen
Purchase Details
Closed on
Dec 30, 2004
Sold by
Dean C Brett and Dean Richelle
Bought by
Moore Mark L and Moore Susanne
Home Financials for this Owner
Home Financials are based on the most recent Mortgage that was taken out on this home.
Original Mortgage
$95,200
Interest Rate
5.74%
Mortgage Type
New Conventional
Create a Home Valuation Report for This Property
The Home Valuation Report is an in-depth analysis detailing your home's value as well as a comparison with similar homes in the area
Home Values in the Area
Average Home Value in this Area
Purchase History
| Date | Buyer | Sale Price | Title Company |
|---|---|---|---|
| Bishop Chelsey | -- | Cache Title | |
| Moore Mark Leon | -- | None Available | |
| Moore Mark L | -- | American Secure Title |
Source: Public Records
Mortgage History
| Date | Status | Borrower | Loan Amount |
|---|---|---|---|
| Previous Owner | Moore Mark L | $95,200 |
Source: Public Records
Tax History Compared to Growth
Tax History
| Year | Tax Paid | Tax Assessment Tax Assessment Total Assessment is a certain percentage of the fair market value that is determined by local assessors to be the total taxable value of land and additions on the property. | Land | Improvement |
|---|---|---|---|---|
| 2025 | $1,394 | $200,110 | $0 | $0 |
| 2024 | $1,485 | $199,080 | $0 | $0 |
| 2023 | $1,503 | $192,670 | $0 | $0 |
| 2022 | $1,568 | $192,670 | $0 | $0 |
| 2021 | $1,547 | $292,845 | $63,000 | $229,845 |
| 2020 | $1,482 | $263,249 | $63,000 | $200,249 |
| 2019 | $1,408 | $235,249 | $35,000 | $200,249 |
| 2018 | $1,295 | $209,130 | $35,000 | $174,130 |
| 2017 | $1,268 | $106,315 | $0 | $0 |
| 2016 | $1,297 | $84,700 | $0 | $0 |
| 2015 | $859 | $70,230 | $0 | $0 |
| 2014 | $840 | $70,230 | $0 | $0 |
| 2013 | -- | $70,230 | $0 | $0 |
Source: Public Records
Map
Nearby Homes
- 155 Wapiti Loop
- 1148 Tule Dr
- 137 Wapiti Loop
- 131 Wapiti Loop
- 1137 Tule Dr
- 1160 Tule Dr
- 167 Wapiti Loop
- 1149 Tule Dr
- 125 Wapiti Loop
- 152 Wapiti Loop
- 1161 Tule Dr
- 134 Wapiti Loop
- 140 Wapiti Loop
- 158 Wapiti Loop
- 146 Wapiti Loop
- 1172 Tule Dr
- 173 Wapiti Loop
- 128 Wapiti Loop
- 164 Wapiti Loop
- 119 Wapiti Loop