Estimated Value: $225,000 - $233,000
3
Beds
2
Baths
1,507
Sq Ft
$152/Sq Ft
Est. Value
About This Home
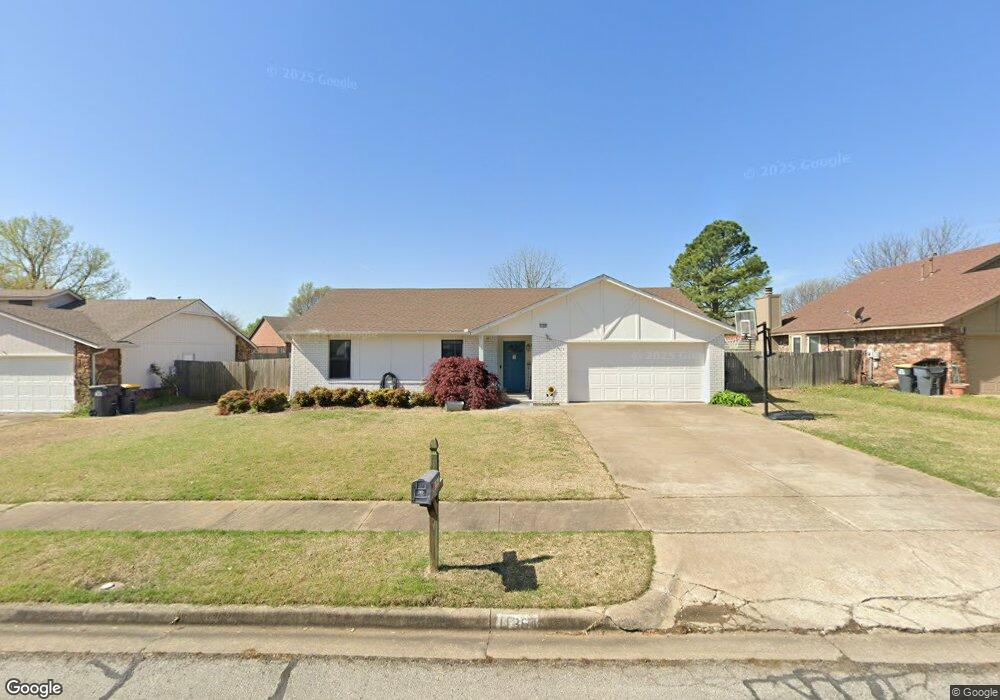
This home is located at 11364 S Franklin Ave, Jenks, OK 74037 and is currently estimated at $228,760, approximately $151 per square foot. 11364 S Franklin Ave is a home located in Tulsa County with nearby schools including Jenks West Elementary School, Jenks West Intermediate Elementary School, and Jenks Middle School.
Ownership History
Date
Name
Owned For
Owner Type
Purchase Details
Closed on
Sep 20, 2013
Sold by
Kravchuk Pavel S and Kravchuk Lissa S
Bought by
Malroney Beau Alan
Current Estimated Value
Home Financials for this Owner
Home Financials are based on the most recent Mortgage that was taken out on this home.
Original Mortgage
$123,408
Outstanding Balance
$92,273
Interest Rate
4.45%
Mortgage Type
FHA
Estimated Equity
$136,487
Purchase Details
Closed on
Jul 25, 2008
Sold by
Hapi Corp
Bought by
Kravchuk Pavel S
Home Financials for this Owner
Home Financials are based on the most recent Mortgage that was taken out on this home.
Original Mortgage
$107,945
Interest Rate
6.4%
Mortgage Type
FHA
Purchase Details
Closed on
Jun 21, 2004
Sold by
Aston Larry and Aston Shannon
Bought by
Hapi Corp
Purchase Details
Closed on
Apr 1, 1995
Create a Home Valuation Report for This Property
The Home Valuation Report is an in-depth analysis detailing your home's value as well as a comparison with similar homes in the area
Home Values in the Area
Average Home Value in this Area
Purchase History
| Date | Buyer | Sale Price | Title Company |
|---|---|---|---|
| Malroney Beau Alan | $125,000 | Charter Title Escrow Co | |
| Kravchuk Pavel S | $110,000 | Tulsa Abstract & Title Co | |
| Hapi Corp | $103,500 | First American Title & Abstr | |
| -- | $70,500 | -- |
Source: Public Records
Mortgage History
| Date | Status | Borrower | Loan Amount |
|---|---|---|---|
| Open | Malroney Beau Alan | $123,408 | |
| Previous Owner | Kravchuk Pavel S | $107,945 |
Source: Public Records
Tax History Compared to Growth
Tax History
| Year | Tax Paid | Tax Assessment Tax Assessment Total Assessment is a certain percentage of the fair market value that is determined by local assessors to be the total taxable value of land and additions on the property. | Land | Improvement |
|---|---|---|---|---|
| 2024 | $2,086 | $17,204 | $2,574 | $14,630 |
| 2023 | $2,086 | $16,385 | $2,760 | $13,625 |
| 2022 | $2,006 | $15,604 | $2,990 | $12,614 |
| 2021 | $1,935 | $14,861 | $2,848 | $12,013 |
| 2020 | $1,893 | $14,861 | $2,848 | $12,013 |
| 2019 | $1,905 | $14,861 | $2,848 | $12,013 |
| 2018 | $1,918 | $14,861 | $2,848 | $12,013 |
| 2017 | $1,833 | $14,438 | $2,767 | $11,671 |
| 2016 | $1,789 | $13,750 | $2,728 | $11,022 |
| 2015 | $1,823 | $13,750 | $2,728 | $11,022 |
| 2014 | $1,864 | $13,750 | $2,728 | $11,022 |
Source: Public Records
Map
Nearby Homes
- 2957 W 114th Place S
- 11275 S Douglas Ave
- 2629 W 115th St S
- 11608 S Union Ave
- 11009 Augusta Dr
- 10739 Masters Cir
- 11710 S Willow Place
- 3710 W 110th St S
- 11728 S Willow Place
- 3706 W 106th St S
- 11206 S Redbud St
- 10910 S Olmsted St
- 12002 S Vine St
- 2012 W 109th St S
- 12108 S Elm St
- 12009 S Umber St
- 11602 S 30th West Ave
- 780 W 121st St S
- 1623 W 114th St
- 1615 W 115th Place
- 11386 S Franklin Ave
- 11342 S Franklin Ave
- 11413 S Franklin Ave
- 11425 S Franklin Ave
- 2924 113th W
- 2924 W 113th St S
- 11418 S Franklin Ave
- 11404 S Franklin Ave
- 2889 W 114th St
- 2935 W 113th St S
- 2986 W 113th St S
- 11433 S Franklin Ave
- 2886 W 113th St S
- 3022 W 113th St S
- 11430 S Emerson Place
- 11414 S Franklin Ave
- 3040 W 113th St S
- 2917 W 113th St S
- 2875 W 114th St
- 11426 S Franklin Ave