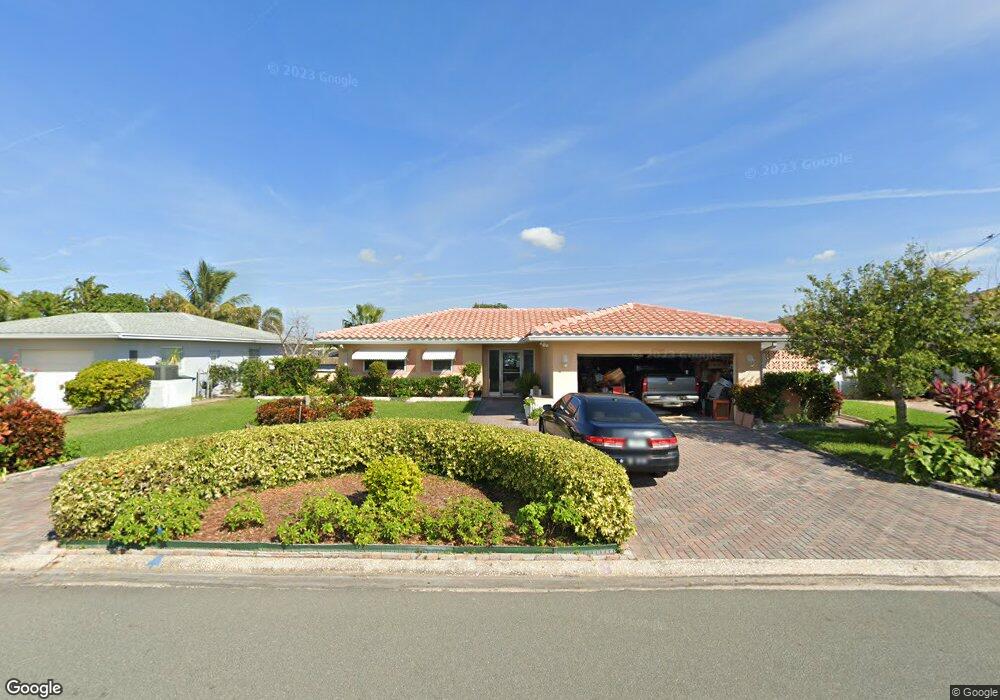
11365 5th St E Treasure Island, FL 33706
Estimated Value: $843,069 - $1,070,000
3
Beds
3
Baths
2,303
Sq Ft
$422/Sq Ft
Est. Value
About This Home
This home is located at 11365 5th St E, Treasure Island, FL 33706 and is currently estimated at $971,517, approximately $421 per square foot. 11365 5th St E is a home located in Pinellas County with nearby schools including Azalea Elementary School, Azalea Middle School, and Boca Ciega High School.
Ownership History
Date
Name
Owned For
Owner Type
Purchase Details
Closed on
Jun 19, 2007
Sold by
Nikolich Djuro and Nikolich Maca
Bought by
Nikolich Djuro and Nikolich Maca
Current Estimated Value
Purchase Details
Closed on
Dec 27, 1993
Sold by
Girard Leonard J and Girard Theresa M
Bought by
Nikolich Djuro and Nikolich Maca
Home Financials for this Owner
Home Financials are based on the most recent Mortgage that was taken out on this home.
Original Mortgage
$210,000
Interest Rate
7.09%
Create a Home Valuation Report for This Property
The Home Valuation Report is an in-depth analysis detailing your home's value as well as a comparison with similar homes in the area
Home Values in the Area
Average Home Value in this Area
Purchase History
| Date | Buyer | Sale Price | Title Company |
|---|---|---|---|
| Nikolich Djuro | -- | Attorney | |
| Nikolich Djuro | $260,000 | -- |
Source: Public Records
Mortgage History
| Date | Status | Borrower | Loan Amount |
|---|---|---|---|
| Closed | Nikolich Djuro | $210,000 |
Source: Public Records
Tax History Compared to Growth
Tax History
| Year | Tax Paid | Tax Assessment Tax Assessment Total Assessment is a certain percentage of the fair market value that is determined by local assessors to be the total taxable value of land and additions on the property. | Land | Improvement |
|---|---|---|---|---|
| 2024 | $4,162 | $302,762 | -- | -- |
| 2023 | $4,162 | $293,944 | $0 | $0 |
| 2022 | $4,049 | $285,383 | $0 | $0 |
| 2021 | $4,116 | $277,071 | $0 | $0 |
| 2020 | $4,066 | $273,246 | $0 | $0 |
| 2019 | $4,000 | $267,103 | $0 | $0 |
| 2018 | $3,912 | $262,123 | $0 | $0 |
| 2017 | $3,865 | $256,732 | $0 | $0 |
| 2016 | $3,840 | $251,452 | $0 | $0 |
| 2015 | $3,913 | $249,704 | $0 | $0 |
| 2014 | $3,896 | $247,722 | $0 | $0 |
Source: Public Records
Map
Nearby Homes