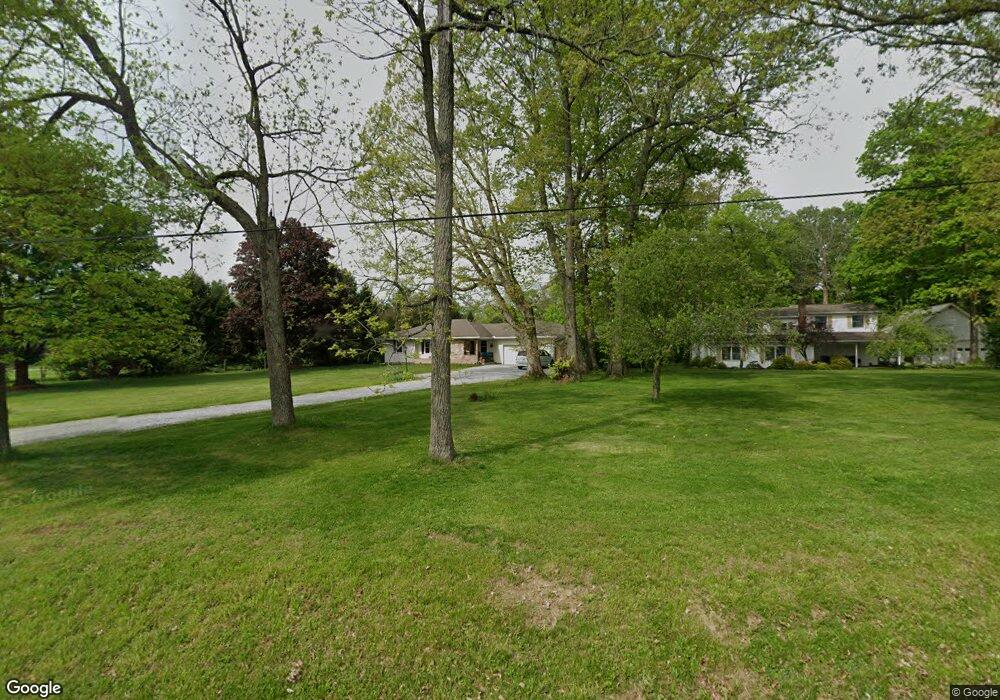
11367 Kenyon Rd Mount Vernon, OH 43050
Estimated Value: $263,000 - $327,242
3
Beds
2
Baths
1,253
Sq Ft
$237/Sq Ft
Est. Value
About This Home
This home is located at 11367 Kenyon Rd, Mount Vernon, OH 43050 and is currently estimated at $297,061, approximately $237 per square foot. 11367 Kenyon Rd is a home located in Knox County with nearby schools including Mount Vernon High School and St. Vincent de Paul School.
Ownership History
Date
Name
Owned For
Owner Type
Purchase Details
Closed on
Oct 29, 2021
Sold by
Jones Thomann Zula
Bought by
Cunningham Cynthia A
Current Estimated Value
Purchase Details
Closed on
Oct 15, 2021
Sold by
Jones Thomann Zula
Bought by
Cunningham Cynthia A
Purchase Details
Closed on
Jan 11, 2012
Sold by
Lucht Russell G and Lucht Dorothy J
Bought by
Equity Trust Co and Bull John A
Purchase Details
Closed on
Mar 27, 1996
Sold by
Lucht Dorothy and Jones Wal
Bought by
Lucht Russell G and Lucht Dorothy
Purchase Details
Closed on
Nov 14, 1995
Sold by
Thomann Zula
Bought by
Lucht Dorothy and Jones Wal
Purchase Details
Closed on
Dec 30, 1993
Sold by
Lucht Russell G and Lucht Dorothy
Bought by
Thomann Zula
Purchase Details
Closed on
May 24, 1993
Sold by
Martin Merlin and Martin Esther
Bought by
Martin Esther and Lucht Rus
Create a Home Valuation Report for This Property
The Home Valuation Report is an in-depth analysis detailing your home's value as well as a comparison with similar homes in the area
Home Values in the Area
Average Home Value in this Area
Purchase History
| Date | Buyer | Sale Price | Title Company |
|---|---|---|---|
| Cunningham Cynthia A | -- | -- | |
| Cunningham Cynthia A | -- | -- | |
| Mclarnan Douglas E | $175,000 | None Available | |
| Equity Trust Co | $64,875 | None Available | |
| Lucht Russell G | $43,800 | -- | |
| Lucht Dorothy | -- | -- | |
| Thomann Zula | $61,500 | -- | |
| Martin Esther | $31,500 | -- |
Source: Public Records
Tax History Compared to Growth
Tax History
| Year | Tax Paid | Tax Assessment Tax Assessment Total Assessment is a certain percentage of the fair market value that is determined by local assessors to be the total taxable value of land and additions on the property. | Land | Improvement |
|---|---|---|---|---|
| 2024 | $2,741 | $74,280 | $18,470 | $55,810 |
| 2023 | $2,741 | $74,280 | $18,470 | $55,810 |
| 2022 | $2,017 | $42,770 | $12,740 | $30,030 |
| 2021 | $2,017 | $42,770 | $12,740 | $30,030 |
| 2020 | $1,968 | $42,770 | $12,740 | $30,030 |
| 2019 | $1,744 | $35,140 | $12,290 | $22,850 |
| 2018 | $1,747 | $35,140 | $12,290 | $22,850 |
| 2017 | $1,721 | $35,140 | $12,290 | $22,850 |
| 2016 | $1,604 | $32,530 | $11,380 | $21,150 |
| 2015 | $1,611 | $32,530 | $11,380 | $21,150 |
| 2014 | $1,618 | $32,530 | $11,380 | $21,150 |
| 2013 | $1,615 | $31,450 | $10,690 | $20,760 |
Source: Public Records
Map
Nearby Homes
- 11791 McManis Rd
- 405 1/2 Gaskin Ave
- 213 Kokosing Dr
- 20090 New Gambier Rd
- 302 E Woodside Dr
- 17980 Gambier Rd
- 20561 Canada Rd
- 17421 Coshocton Rd
- 17375 Gambier Rd
- 84 Woodlake Trail
- 104 Colonial Woods Dr Unit 4
- 117 Colonial Woods Dr
- 0 Venture Dr Unit 20240369
- 42 Wildwood Ln
- 0 Wildwood Ln
- 188 Plymouth Rd
- 55 Wildwood Ln
- 12627 Upper Gilchrist Rd
- 60 Wildwood Ln
- 207 Tamarack Dr
- 11385 Kenyon Rd
- 11321 Kenyon Rd
- 11419 Kenyon Rd
- 11285 Kenyon Rd
- 11290 Kenyon Rd
- 11455 Kenyon Rd
- 11469 Kenyon Rd
- 11281 Kenyon Rd
- 11487 Kenyon Rd
- 11275 Kenyon Rd
- 18894 Yauger Rd
- 11540 Kenyon Rd
- 18909 New Gambier Rd
- 11370 Kenyon Rd
- 19011 New Gambier Rd
- 19027 New Gambier Rd
- 18766 Yauger Rd
- 11563 McManis Rd
- 11581 Kenyon Rd
- 11580 Kenyon Rd