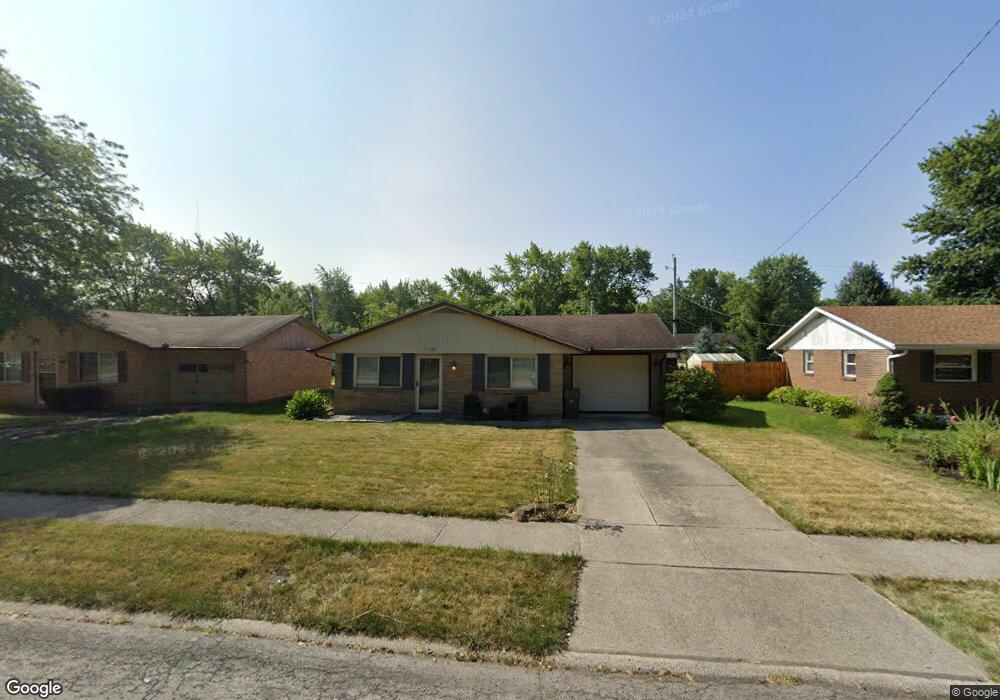
1137 Biscayne Dr Lima, OH 45801
Northside Lima NeighborhoodEstimated Value: $127,000 - $150,000
3
Beds
1
Bath
1,161
Sq Ft
$122/Sq Ft
Est. Value
About This Home
This home is located at 1137 Biscayne Dr, Lima, OH 45801 and is currently estimated at $141,492, approximately $121 per square foot. 1137 Biscayne Dr is a home located in Allen County with nearby schools including Elida Elementary School, Elida Middle School, and Elida High School.
Ownership History
Date
Name
Owned For
Owner Type
Purchase Details
Closed on
May 1, 2025
Sold by
Anderson Karen Elaine
Bought by
Anderson Karen Elaine and Kelly-Pinn Karen Elaine
Current Estimated Value
Purchase Details
Closed on
Jul 25, 2023
Sold by
Myrtis Mcclendon Revocable Living Trust
Bought by
Anderson Karen Elaine
Home Financials for this Owner
Home Financials are based on the most recent Mortgage that was taken out on this home.
Original Mortgage
$116,000
Interest Rate
6.67%
Mortgage Type
New Conventional
Purchase Details
Closed on
Mar 31, 2006
Sold by
Mcclendon Myrtis D
Bought by
Mcclendon Myrtis D and Mcclendon Revocable L Myrtis D
Purchase Details
Closed on
Aug 1, 1977
Bought by
Mcclendon Myrtis D
Create a Home Valuation Report for This Property
The Home Valuation Report is an in-depth analysis detailing your home's value as well as a comparison with similar homes in the area
Home Values in the Area
Average Home Value in this Area
Purchase History
| Date | Buyer | Sale Price | Title Company |
|---|---|---|---|
| Anderson Karen Elaine | -- | None Listed On Document | |
| Anderson Karen Elaine | $116,000 | None Listed On Document | |
| Mcclendon Myrtis D | -- | None Available | |
| Mcclendon Myrtis D | $33,400 | -- |
Source: Public Records
Mortgage History
| Date | Status | Borrower | Loan Amount |
|---|---|---|---|
| Previous Owner | Anderson Karen Elaine | $116,000 |
Source: Public Records
Tax History
| Year | Tax Paid | Tax Assessment Tax Assessment Total Assessment is a certain percentage of the fair market value that is determined by local assessors to be the total taxable value of land and additions on the property. | Land | Improvement |
|---|---|---|---|---|
| 2024 | $1,507 | $37,170 | $5,110 | $32,060 |
| 2023 | $780 | $25,660 | $3,540 | $22,120 |
| 2022 | $806 | $25,660 | $3,540 | $22,120 |
| 2021 | $811 | $25,660 | $3,540 | $22,120 |
| 2020 | $610 | $20,380 | $3,330 | $17,050 |
| 2019 | $610 | $20,380 | $3,330 | $17,050 |
| 2018 | $632 | $20,380 | $3,330 | $17,050 |
| 2017 | $584 | $20,380 | $3,330 | $17,050 |
| 2016 | $583 | $20,380 | $3,330 | $17,050 |
| 2015 | $664 | $20,380 | $3,330 | $17,050 |
| 2014 | $664 | $21,850 | $3,330 | $18,520 |
| 2013 | $645 | $21,850 | $3,330 | $18,520 |
Source: Public Records
Map
Nearby Homes
- 1164 Bahama Dr
- 1580 W Robb Ave
- 1883 Brookhaven Dr Unit 2
- 1027 Sherman Ave
- 760 W O'Connor Ave
- 1143 Brower Rd
- 1317 Virginia Ave
- 1212 Virginia Ave
- 1889 N Metcalf St
- 645 W O'Connor Ave
- 2300 Mandolin Dr
- 1014 Brower Rd
- 2113 Kimberly Dr
- 2129 Reinell Ave
- 608 W O'Connor Ave
- 2371 Mandolin Dr
- 1015 N Cole St
- 2380 Mandolin Dr
- 00 Homeward Ave
- 1730 Homeward Ave
- 1133 Biscayne Dr
- 1141 Biscayne Dr
- 1129 Biscayne Dr
- 1145 Biscayne Dr
- 1160 Bahama Dr
- 1156 Bahama Dr
- 1150 Bahama Dr
- 1125 Biscayne Dr
- 1168 Bahama Dr
- 1132 Biscayne Dr
- 1128 Biscayne Dr
- 1149 Biscayne Dr
- 1136 Biscayne Dr
- 1144 Bahama Dr
- 1140 Biscayne Dr
- 1172 Bahama Dr
- 1120 Biscayne Dr
- 1121 Biscayne Dr
- 1153 Biscayne Dr
Your Personal Tour Guide
Ask me questions while you tour the home.