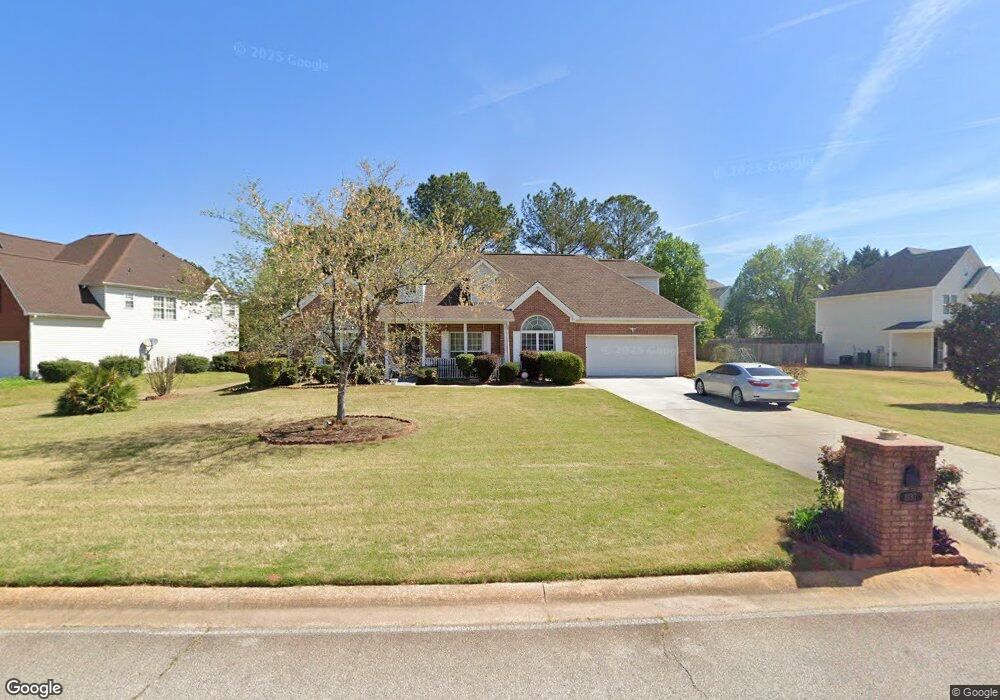
1137 E Shoreview Rd McDonough, GA 30253
Estimated Value: $338,000 - $370,000
4
Beds
3
Baths
2,773
Sq Ft
$129/Sq Ft
Est. Value
About This Home
This home is located at 1137 E Shoreview Rd, McDonough, GA 30253 and is currently estimated at $356,929, approximately $128 per square foot. 1137 E Shoreview Rd is a home located in Henry County with nearby schools including Wesley Lakes Elementary School, McDonough Middle School, and McDonough Methodist Academy.
Ownership History
Date
Name
Owned For
Owner Type
Purchase Details
Closed on
Dec 24, 2024
Sold by
Singletary Rosetta Y
Bought by
Singletary Howard N and Singletary Rosetta Y
Current Estimated Value
Home Financials for this Owner
Home Financials are based on the most recent Mortgage that was taken out on this home.
Original Mortgage
$555,000
Outstanding Balance
$554,711
Interest Rate
6.81%
Mortgage Type
New Conventional
Estimated Equity
-$197,782
Purchase Details
Closed on
May 5, 2009
Sold by
Fannie Mae
Bought by
Singletary Rosetta Y
Home Financials for this Owner
Home Financials are based on the most recent Mortgage that was taken out on this home.
Original Mortgage
$107,142
Interest Rate
4.81%
Mortgage Type
FHA
Purchase Details
Closed on
Nov 4, 2008
Sold by
Everhome Mortgage
Bought by
Federal National Mortgage Association
Purchase Details
Closed on
May 23, 2003
Sold by
Mckeehan Contractors Llc
Bought by
Collins Tommie E
Home Financials for this Owner
Home Financials are based on the most recent Mortgage that was taken out on this home.
Original Mortgage
$196,000
Interest Rate
5.79%
Mortgage Type
New Conventional
Create a Home Valuation Report for This Property
The Home Valuation Report is an in-depth analysis detailing your home's value as well as a comparison with similar homes in the area
Home Values in the Area
Average Home Value in this Area
Purchase History
| Date | Buyer | Sale Price | Title Company |
|---|---|---|---|
| Singletary Howard N | -- | -- | |
| Singletary Rosetta Y | -- | -- | |
| Federal National Mortgage Association | -- | -- | |
| Everhome Mortgage Co | $253,742 | -- | |
| Collins Tommie E | $196,000 | -- |
Source: Public Records
Mortgage History
| Date | Status | Borrower | Loan Amount |
|---|---|---|---|
| Open | Singletary Howard N | $555,000 | |
| Previous Owner | Singletary Rosetta Y | $107,142 | |
| Previous Owner | Collins Tommie E | $196,000 |
Source: Public Records
Tax History
| Year | Tax Paid | Tax Assessment Tax Assessment Total Assessment is a certain percentage of the fair market value that is determined by local assessors to be the total taxable value of land and additions on the property. | Land | Improvement |
|---|---|---|---|---|
| 2025 | $1,280 | $145,800 | $18,000 | $127,800 |
| 2024 | $1,280 | $147,360 | $18,000 | $129,360 |
| 2023 | $898 | $145,800 | $14,800 | $131,000 |
| 2022 | $1,070 | $121,080 | $14,000 | $107,080 |
| 2021 | $1,059 | $95,760 | $14,000 | $81,760 |
| 2020 | $1,043 | $86,560 | $12,800 | $73,760 |
| 2019 | $1,095 | $82,840 | $12,800 | $70,040 |
| 2018 | $1,015 | $70,800 | $8,000 | $62,800 |
| 2016 | $839 | $58,440 | $6,000 | $52,440 |
| 2015 | $829 | $53,840 | $6,000 | $47,840 |
| 2014 | $688 | $48,120 | $6,000 | $42,120 |
Source: Public Records
Map
Nearby Homes
- 189 Spyglass Cir
- 1105 Burlington Ct
- 1130 Ivey Ln
- 301 Heavenly Hollow Place
- 1401 Leafar Way Unit 262
- 705 Compton Ln
- 505 Chipwood Ct
- 1158 Folkstone Dr
- 245 Vaness Dr
- 655 Gardinia Dr
- 316 Sierra Ct
- 125 Concord Terrace
- 109 Burleyson Dr
- 237 Jetta Cir
- 365 Emporia Loop
- 1107 Folkstone Dr
- 116 Madeline Ct
- 448 Emporia Loop
- 326 Emporia Loop
- 715 Quail Cir
- 1133 E Shoreview Rd Unit 1
- 1141 E Shoreview Rd
- 105 Haskell Ct Unit 1
- 1129 E Shoreview Rd
- 1138 E Shoreview Rd Unit 1
- 1143 E Shoreview Rd
- 103 Haskell Ct Unit 1
- 1136 E Shoreview Rd Unit 1
- 1136 E Shoreview Rd Unit 45
- 1140 E Shoreview Rd
- 106 Haskell Ct
- 1142 E Shoreview Rd
- 1125 E Shoreview Rd
- 1134 E Shoreview Rd Unit 1
- 1130 E Shoreview Rd Unit 1
- 101 Haskell Ct
- 1145 E Shoreview Rd
- 1144 E Shoreview Rd
- 104 Haskell Ct
Your Personal Tour Guide
Ask me questions while you tour the home.