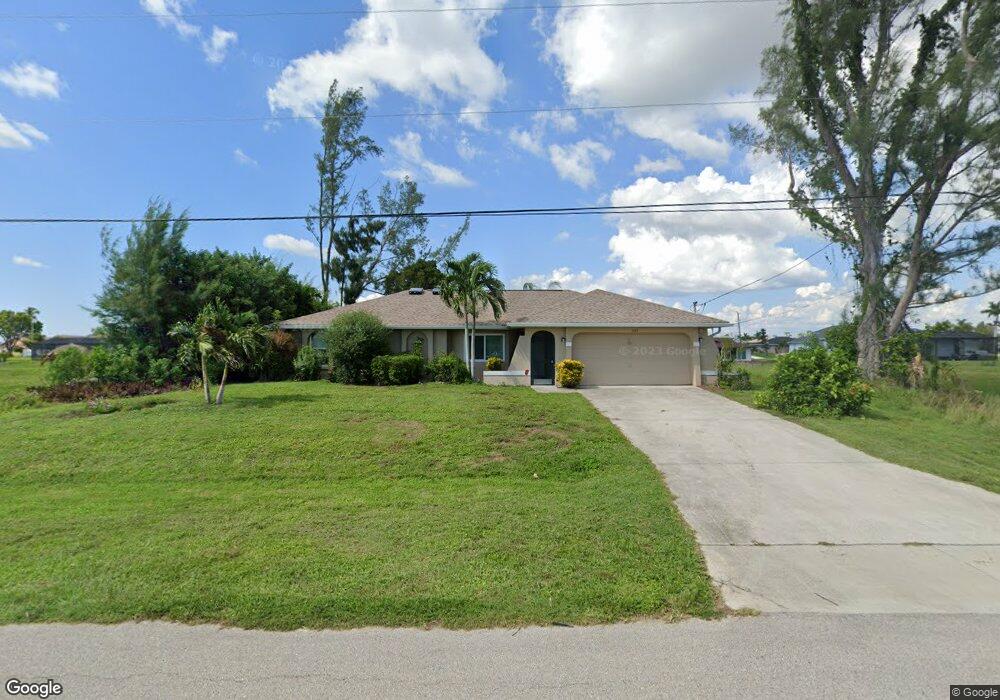
1137 SW 24th St Cape Coral, FL 33991
Trafalgar NeighborhoodEstimated Value: $364,000 - $442,000
3
Beds
2
Baths
2,177
Sq Ft
$180/Sq Ft
Est. Value
About This Home
This home is located at 1137 SW 24th St, Cape Coral, FL 33991 and is currently estimated at $391,710, approximately $179 per square foot. 1137 SW 24th St is a home located in Lee County with nearby schools including Cape Elementary School, Caloosa Elementary School, and Tropic Isles Elementary School.
Ownership History
Date
Name
Owned For
Owner Type
Purchase Details
Closed on
Jul 19, 2022
Sold by
Ray Bunch Jr Jimmy
Bought by
Bunch Jimmy Ray and Bunch Patricia Lynn
Current Estimated Value
Purchase Details
Closed on
Apr 14, 2015
Sold by
Fannie Mae
Bought by
Bunch Jimmy R
Home Financials for this Owner
Home Financials are based on the most recent Mortgage that was taken out on this home.
Original Mortgage
$120,000
Interest Rate
3.84%
Mortgage Type
New Conventional
Purchase Details
Closed on
Nov 11, 2014
Sold by
Frank Jack and Frank Joann A
Bought by
Federal National Mortgage Association
Create a Home Valuation Report for This Property
The Home Valuation Report is an in-depth analysis detailing your home's value as well as a comparison with similar homes in the area
Home Values in the Area
Average Home Value in this Area
Purchase History
| Date | Buyer | Sale Price | Title Company |
|---|---|---|---|
| Bunch Jimmy Ray | -- | None Listed On Document | |
| Bunch Jimmy R | $150,000 | First Intl Title Inc | |
| Federal National Mortgage Association | $203,936 | Attorney |
Source: Public Records
Mortgage History
| Date | Status | Borrower | Loan Amount |
|---|---|---|---|
| Previous Owner | Bunch Jimmy R | $120,000 |
Source: Public Records
Tax History Compared to Growth
Tax History
| Year | Tax Paid | Tax Assessment Tax Assessment Total Assessment is a certain percentage of the fair market value that is determined by local assessors to be the total taxable value of land and additions on the property. | Land | Improvement |
|---|---|---|---|---|
| 2025 | $6,666 | $315,630 | -- | -- |
| 2024 | $5,952 | $286,936 | -- | -- |
| 2023 | $5,952 | $260,851 | $0 | $0 |
| 2022 | $5,444 | $239,588 | $0 | $0 |
| 2021 | $4,175 | $164,182 | $27,548 | $136,634 |
| 2020 | $4,001 | $149,392 | $25,000 | $124,392 |
| 2019 | $5,212 | $146,961 | $19,000 | $127,961 |
| 2018 | $5,075 | $138,088 | $19,000 | $119,088 |
| 2017 | $5,009 | $133,234 | $16,000 | $117,234 |
| 2016 | $4,793 | $121,805 | $18,989 | $102,816 |
| 2015 | $4,592 | $106,501 | $16,614 | $89,887 |
| 2014 | -- | $101,989 | $15,717 | $86,272 |
| 2013 | -- | $93,603 | $14,663 | $78,940 |
Source: Public Records
Map
Nearby Homes
- 1206 SW 23rd St
- 519 SW 22nd Terrace
- 1121 SW 22nd Terrace
- 1121 SW 25th St
- 334 SW 23rd St
- 1602 SW 23rd St
- 2405 SW 11th Ave
- 2218 SW 12th Place
- 2133 SW Pine Ln Unit 1
- 2416 SW 10th Ave
- 2127 SW Pine Ln Unit 3
- 1409 SW 24th St
- 1005 SW 22nd Terrace
- 2506 SW 10th Ave
- 812 Palmetto Pointe Cir
- 2214 SW 14th Ave
- 917 SW 23rd St
- 2533 SW 11th Place
- 2535 SW 11th Ave
- 2526 SW 10th Ave Unit 66
- 1133 SW 24th St
- 1129 SW 24th St
- 1145 SW 24th St
- 1138 SW 24th St
- 1140 SW 24th St
- 1138 SW 23rd St
- 1142 SW 23rd St
- 1134 SW 24th St
- 1134 SW 23rd St
- 1201 SW 24th St
- 1146 SW 23rd St
- 1130 SW 24th St
- 1144 SW 24th St
- 1202 SW 23rd St
- 1128 SW 23rd St
- 1205 SW 24th St
- 1121 SW 24th St
- 1126 SW 24th St
- 2236 SW 11th Ct
- 2235 SW 12th Ave