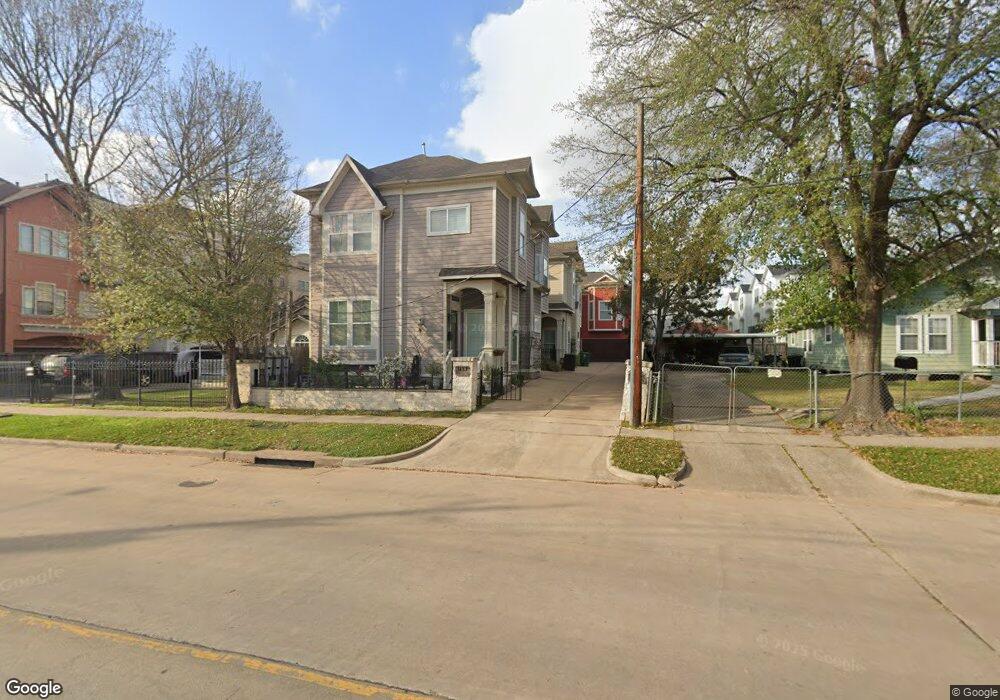
1137 W 23rd St Unit B Houston, TX 77008
Greater Heights NeighborhoodEstimated Value: $411,749 - $505,000
3
Beds
3
Baths
1,787
Sq Ft
$260/Sq Ft
Est. Value
About This Home
This home is located at 1137 W 23rd St Unit B, Houston, TX 77008 and is currently estimated at $464,437, approximately $259 per square foot. 1137 W 23rd St Unit B is a home located in Harris County with nearby schools including Sinclair Elementary School, Hamilton Middle, and Waltrip High School.
Ownership History
Date
Name
Owned For
Owner Type
Purchase Details
Closed on
Mar 12, 2024
Sold by
Young Brittany T and Young Connor R
Bought by
Amdg Living Trust
Current Estimated Value
Purchase Details
Closed on
Sep 13, 2019
Sold by
Horneman Mary A
Bought by
Young Brittany T and Young Connor R
Home Financials for this Owner
Home Financials are based on the most recent Mortgage that was taken out on this home.
Original Mortgage
$290,000
Interest Rate
3.7%
Mortgage Type
New Conventional
Purchase Details
Closed on
Apr 27, 2007
Sold by
Titan De Leon Developments Lp
Bought by
Horneman Mary A
Home Financials for this Owner
Home Financials are based on the most recent Mortgage that was taken out on this home.
Original Mortgage
$209,024
Interest Rate
6.13%
Mortgage Type
Purchase Money Mortgage
Create a Home Valuation Report for This Property
The Home Valuation Report is an in-depth analysis detailing your home's value as well as a comparison with similar homes in the area
Home Values in the Area
Average Home Value in this Area
Purchase History
| Date | Buyer | Sale Price | Title Company |
|---|---|---|---|
| Amdg Living Trust | -- | None Listed On Document | |
| Young Brittany T | -- | Old Republic Natl Ttl Ins Co | |
| Horneman Mary A | -- | Etc |
Source: Public Records
Mortgage History
| Date | Status | Borrower | Loan Amount |
|---|---|---|---|
| Previous Owner | Young Brittany T | $290,000 | |
| Previous Owner | Horneman Mary A | $209,024 |
Source: Public Records
Tax History Compared to Growth
Tax History
| Year | Tax Paid | Tax Assessment Tax Assessment Total Assessment is a certain percentage of the fair market value that is determined by local assessors to be the total taxable value of land and additions on the property. | Land | Improvement |
|---|---|---|---|---|
| 2025 | $5,933 | $409,100 | $167,650 | $241,450 |
| 2024 | $5,933 | $405,637 | $167,650 | $237,987 |
| 2023 | $5,933 | $410,499 | $131,725 | $278,774 |
| 2022 | $7,459 | $348,440 | $107,775 | $240,665 |
| 2021 | $7,177 | $307,949 | $107,775 | $200,174 |
| 2020 | $8,187 | $338,077 | $107,775 | $230,302 |
| 2019 | $7,565 | $298,960 | $107,775 | $191,185 |
| 2018 | $5,934 | $306,536 | $107,775 | $198,761 |
| 2017 | $7,751 | $306,536 | $107,775 | $198,761 |
| 2016 | $7,499 | $321,596 | $107,775 | $213,821 |
| 2015 | $4,887 | $282,039 | $102,985 | $179,054 |
| 2014 | $4,887 | $0 | $0 | $0 |
Source: Public Records
Map
Nearby Homes
- 1135 W 24th St Unit A
- 1124 W 24th St Unit B
- 1207 W 24th St Unit A
- 1124 W 23rd St
- 1138 W 25th St Unit F
- 1149 W 22nd St
- 1131 W 22nd St
- 1114 W 25th St
- 1250 W 23rd St
- 1241 W 24th St Unit C
- 2416 Bevis St
- 2308 Bevis St
- 1239 W 22nd St Unit C
- 1126 W 22nd St
- 1031 W 23rd St
- 1030 W 24th St Unit B
- 1235 W 25th St
- 1128 W 26th St
- 2426 Bevis St
- 1230 W 26th St
- 1137 W 23rd St Unit A
- 1137 W 23rd St Unit C
- 1139 W 23rd St
- 1135 W 23rd St
- 1141B W 23rd St
- 1130 W 23rd St
- 1141 W 23rd St
- 1133 W 23rd St
- 1140 W 24th St
- 1140 W 24th St Unit C
- 1140 W 24th St Unit A
- 1140 W 24th St Unit E
- 1140 W 24th St Unit B
- 1140 W 24th St Unit D
- 1211 W 23rd St
- 1213 W 23rd St
- 1134 W 24th St
- 1141 W 23rd St
- 1141 W 23rd St
- 1141 W 23rd St Unit D