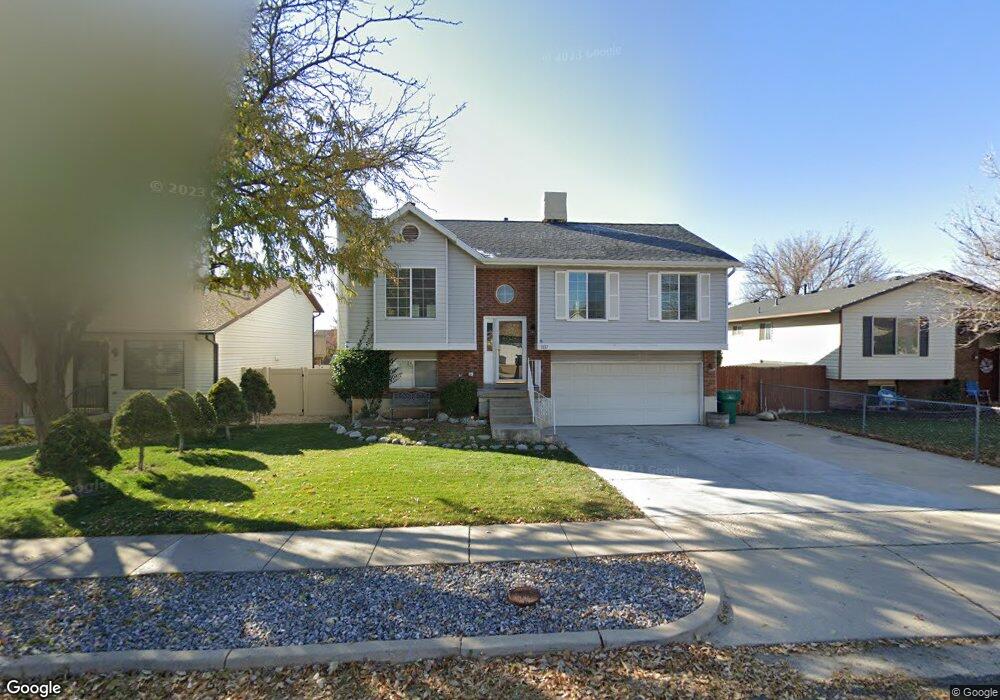
1137 W 2525 N Layton, UT 84041
Estimated Value: $397,000 - $436,000
3
Beds
2
Baths
1,058
Sq Ft
$391/Sq Ft
Est. Value
About This Home
This home is located at 1137 W 2525 N, Layton, UT 84041 and is currently estimated at $413,242, approximately $390 per square foot. 1137 W 2525 N is a home located in Davis County with nearby schools including Lincoln Elementary School, North Layton Junior High School, and Northridge High School.
Ownership History
Date
Name
Owned For
Owner Type
Purchase Details
Closed on
Apr 2, 2009
Sold by
Jepson Julene N and Jepson Shane W
Bought by
Jepson Shane W and Jepson Julene N
Current Estimated Value
Home Financials for this Owner
Home Financials are based on the most recent Mortgage that was taken out on this home.
Original Mortgage
$119,200
Interest Rate
5.04%
Mortgage Type
New Conventional
Purchase Details
Closed on
Dec 14, 2001
Sold by
Nelson Michael R
Bought by
Jepson Julene Nelson and Nelson Julene
Purchase Details
Closed on
Dec 12, 2001
Sold by
Jepson Julene Nelson
Bought by
Jepson Shane W and Jepson Julene N
Purchase Details
Closed on
Mar 19, 1996
Sold by
Nelson Julene and Jepson Julene Nelson
Bought by
Jepson Julene Nelson
Home Financials for this Owner
Home Financials are based on the most recent Mortgage that was taken out on this home.
Original Mortgage
$76,850
Interest Rate
7.84%
Create a Home Valuation Report for This Property
The Home Valuation Report is an in-depth analysis detailing your home's value as well as a comparison with similar homes in the area
Home Values in the Area
Average Home Value in this Area
Purchase History
| Date | Buyer | Sale Price | Title Company |
|---|---|---|---|
| Jepson Shane W | -- | Bonneville Superior Title | |
| Jepson Julene Nelson | -- | Inwest Title Services Inc | |
| Jepson Shane W | -- | Inwest Title Services Inc | |
| Jepson Julene Nelson | -- | Bonneville Title Company Inc |
Source: Public Records
Mortgage History
| Date | Status | Borrower | Loan Amount |
|---|---|---|---|
| Closed | Jepson Shane W | $119,200 | |
| Closed | Jepson Julene Nelson | $76,850 |
Source: Public Records
Tax History Compared to Growth
Tax History
| Year | Tax Paid | Tax Assessment Tax Assessment Total Assessment is a certain percentage of the fair market value that is determined by local assessors to be the total taxable value of land and additions on the property. | Land | Improvement |
|---|---|---|---|---|
| 2024 | $1,862 | $196,900 | $102,610 | $94,290 |
| 2023 | $1,856 | $346,000 | $129,836 | $216,164 |
| 2022 | $1,907 | $193,050 | $66,274 | $126,776 |
| 2021 | $1,722 | $260,000 | $86,997 | $173,003 |
| 2020 | $1,547 | $224,000 | $75,671 | $148,329 |
| 2019 | $1,558 | $221,000 | $74,193 | $146,807 |
| 2018 | $1,384 | $197,000 | $74,193 | $122,807 |
| 2016 | $1,232 | $90,475 | $22,084 | $68,391 |
| 2015 | $1,154 | $80,465 | $22,084 | $58,381 |
| 2014 | $1,162 | $82,827 | $22,084 | $60,743 |
| 2013 | -- | $80,442 | $20,680 | $59,762 |
Source: Public Records
Map
Nearby Homes
- 2887 N 1175 W
- 2402 N 725 W
- 2949 N 1175 W
- 2378 N 675 W
- 850 S 1650 E Unit D
- 781 W 2150 N
- 1548 E 925 S
- 709 W Highway 193
- 2211 N 525 W
- 2875 N Hill Field Rd Unit 58
- 2875 N Hill Field Rd Unit 17
- 2875 N Hill Field Rd Unit 62
- 1606 W 1960 N
- 2187 N 450 W
- 1665 W 1960 N
- 1208 Valhalla Dr
- 65 Sunset Dr
- 63 Sunset Dr
- 1900 N 1690 W
- 1094 N Angel St W
- 1147 W 2525 N
- 1127 W 2525 N
- 1164 W 2450 N
- 1154 W 2450 N
- 1117 W 2525 N
- 1155 W 2525 N
- 1144 W 2450 N
- 1170 W 2450 N
- 1134 W 2525 N
- 1124 W 2525 N
- 1165 W 2525 N
- 2548 N 1150 W
- 1109 W 2525 N
- 1134 W 2450 N
- 1180 W 2450 N
- 1114 W 2525 N
- 1124 W 2450 N
- 2480 University Park Blvd
- 2515 N 1100 W
- 2460 University Park Blvd