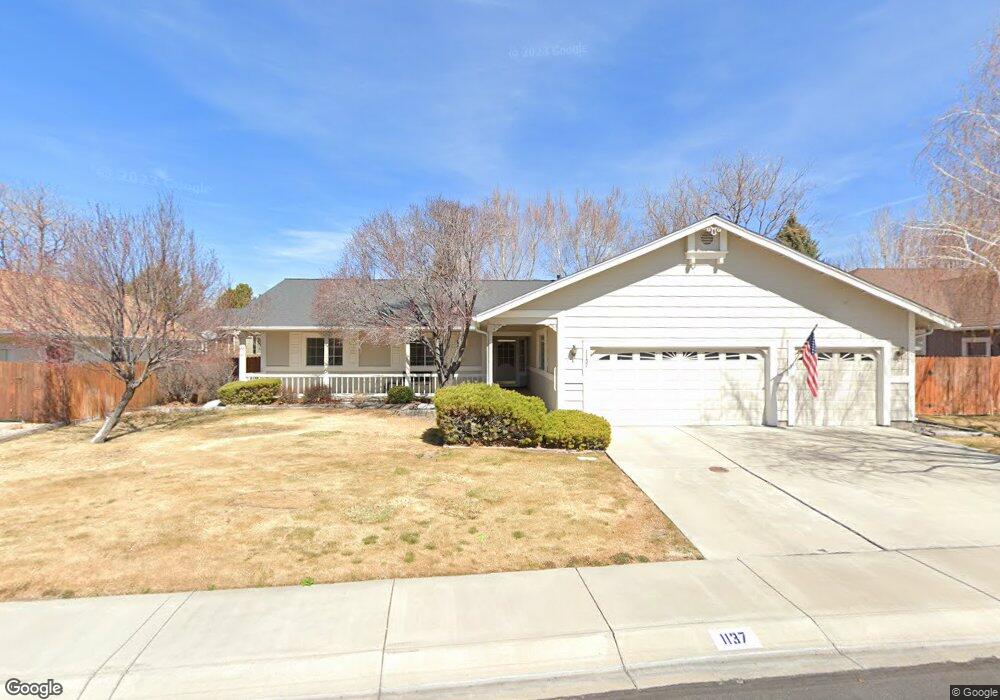
1137 Wisteria Dr Unit 4 Minden, NV 89423
Estimated Value: $599,000 - $679,000
3
Beds
3
Baths
1,848
Sq Ft
$340/Sq Ft
Est. Value
About This Home
This home is located at 1137 Wisteria Dr Unit 4, Minden, NV 89423 and is currently estimated at $627,543, approximately $339 per square foot. 1137 Wisteria Dr Unit 4 is a home located in Douglas County with nearby schools including Minden Elementary School, Carson Valley Middle School, and Douglas County High School.
Ownership History
Date
Name
Owned For
Owner Type
Purchase Details
Closed on
Jun 26, 2024
Sold by
Brown Gregory Dale and Brown Holly
Bought by
Brown Gregory Dale
Current Estimated Value
Home Financials for this Owner
Home Financials are based on the most recent Mortgage that was taken out on this home.
Original Mortgage
$255,000
Outstanding Balance
$251,657
Interest Rate
6.5%
Mortgage Type
New Conventional
Estimated Equity
$375,886
Purchase Details
Closed on
Nov 27, 2019
Sold by
Brown Gregory Dale and Brown Holly Susan
Bought by
Brown Gregory Dale and Brown Holly Susan
Purchase Details
Closed on
Jul 20, 2011
Sold by
Lane Gordon R and Lane Carol L
Bought by
Brown Gregory D and Brown Holly S
Purchase Details
Closed on
Jul 31, 2006
Sold by
Lane Gordon and Lane Carol
Bought by
Lane Gordon R and Lane Carol L
Create a Home Valuation Report for This Property
The Home Valuation Report is an in-depth analysis detailing your home's value as well as a comparison with similar homes in the area
Home Values in the Area
Average Home Value in this Area
Purchase History
| Date | Buyer | Sale Price | Title Company |
|---|---|---|---|
| Brown Gregory Dale | -- | First Centennial Title | |
| Brown Gregory Dale | -- | None Available | |
| Brown Gregory Dale | -- | None Available | |
| Brown Gregory D | $225,000 | Northern Nevada Title Cc | |
| Lane Gordon R | -- | None Available |
Source: Public Records
Mortgage History
| Date | Status | Borrower | Loan Amount |
|---|---|---|---|
| Open | Brown Gregory Dale | $255,000 |
Source: Public Records
Tax History Compared to Growth
Tax History
| Year | Tax Paid | Tax Assessment Tax Assessment Total Assessment is a certain percentage of the fair market value that is determined by local assessors to be the total taxable value of land and additions on the property. | Land | Improvement |
|---|---|---|---|---|
| 2025 | $3,315 | $107,462 | $38,500 | $68,962 |
| 2024 | $3,315 | $108,381 | $38,500 | $69,881 |
| 2023 | $3,219 | $103,375 | $38,500 | $64,875 |
| 2022 | $3,131 | $96,204 | $35,000 | $61,204 |
| 2021 | $3,042 | $89,978 | $31,500 | $58,478 |
| 2020 | $2,952 | $89,510 | $31,500 | $58,010 |
| 2019 | $2,866 | $82,444 | $28,000 | $57,244 |
| 2018 | $2,783 | $80,034 | $24,500 | $55,534 |
| 2017 | $2,701 | $81,890 | $24,500 | $57,390 |
| 2016 | $2,632 | $78,824 | $21,000 | $57,824 |
| 2015 | $2,722 | $78,824 | $21,000 | $57,824 |
| 2014 | $2,642 | $73,982 | $19,250 | $54,732 |
Source: Public Records
Map
Nearby Homes
- 1123 Wisteria Dr
- 1760 Iris Ct
- 1174 Wisteria Dr
- 1151 White Oak Loop
- 1756 Bella Casa Dr
- 1721 Lantana Dr
- 1775 Linden Ct
- 1762 La Cita Way
- 1701 Lantana Dr
- 1791 La Cita Way
- 1783 Torina Way
- 1749 Bougainvillea Dr
- 1769 Evergreen Ct Unit 156
- 1782 Torina Way Unit 43
- 1058 Frieda Ln
- 1786 Monte Vista Ave
- 1719 Bougainvillea Dr
- 00 Muller Pkwy
- 1686 W Minden Village Loop
- 1707 Monticello Ct
- 1135 Wisteria Dr
- 1139 Wisteria Dr
- 1834 Bougainvillea Dr
- 1824 Bougainvillea Dr
- 1138 Wisteria Dr
- 1141 Wisteria Dr
- 1838 Bougainvillea Dr
- 1134 Wisteria Dr Unit 4
- 1142 Wisteria Dr
- 1842 Bougainvillea Dr
- 1133 Wisteria Dr
- 1772 Iris Ct
- 1818 Bougainvillea Dr
- 1831 Bougainvillea Dr
- 1835 Bougainvillea Dr
- 1827 Bougainvillea Dr Unit 8
- 1130 Wisteria Dr
- 1839 Bougainvillea Dr
- 1823 Bougainvillea Dr
- 997 Lilac Ct