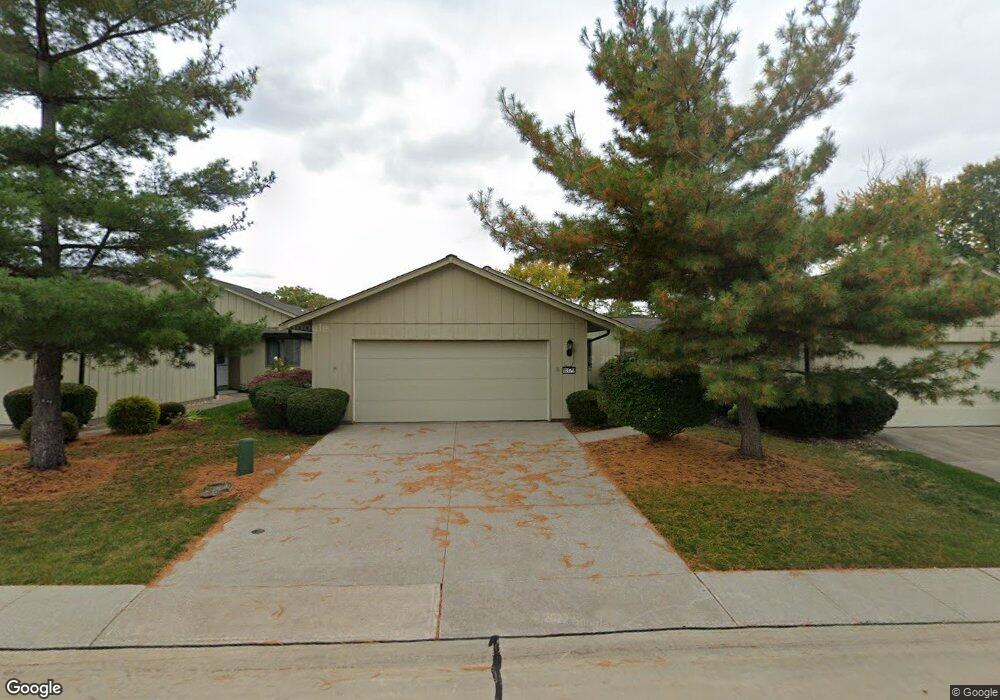
11379 Co Moor Blvd Strongsville, OH 44149
Estimated Value: $248,000 - $305,000
2
Beds
2
Baths
1,452
Sq Ft
$186/Sq Ft
Est. Value
About This Home
This home is located at 11379 Co Moor Blvd, Strongsville, OH 44149 and is currently estimated at $269,594, approximately $185 per square foot. 11379 Co Moor Blvd is a home located in Cuyahoga County with nearby schools including Strongsville High School and Sts Joseph & John Interparochial School.
Ownership History
Date
Name
Owned For
Owner Type
Purchase Details
Closed on
May 11, 2018
Sold by
Gaab Rolf G
Bought by
Gaab Ryan R
Current Estimated Value
Purchase Details
Closed on
Aug 20, 2008
Sold by
Seelbrede June
Bought by
Gaab Rolf G
Home Financials for this Owner
Home Financials are based on the most recent Mortgage that was taken out on this home.
Original Mortgage
$121,600
Outstanding Balance
$80,161
Interest Rate
6.42%
Mortgage Type
Purchase Money Mortgage
Estimated Equity
$189,433
Purchase Details
Closed on
Nov 1, 2000
Sold by
Sager Esther D
Bought by
Seelbrede Herbert and Seelbrede June
Home Financials for this Owner
Home Financials are based on the most recent Mortgage that was taken out on this home.
Original Mortgage
$25,000
Interest Rate
7.96%
Purchase Details
Closed on
Oct 9, 1987
Bought by
Sager Esther D
Purchase Details
Closed on
Mar 27, 1987
Bought by
Fannin Bldrs. Inc
Purchase Details
Closed on
Jan 1, 1986
Bought by
Co-Moor Colony Sec 12 Inc
Create a Home Valuation Report for This Property
The Home Valuation Report is an in-depth analysis detailing your home's value as well as a comparison with similar homes in the area
Home Values in the Area
Average Home Value in this Area
Purchase History
| Date | Buyer | Sale Price | Title Company |
|---|---|---|---|
| Gaab Ryan R | -- | None Available | |
| Gaab Rolf G | $152,000 | Signature Title | |
| Seelbrede Herbert | $130,000 | -- | |
| Sager Esther D | $101,800 | -- | |
| Fannin Bldrs. Inc | -- | -- | |
| Co-Moor Colony Sec 12 Inc | -- | -- |
Source: Public Records
Mortgage History
| Date | Status | Borrower | Loan Amount |
|---|---|---|---|
| Open | Gaab Rolf G | $121,600 | |
| Previous Owner | Seelbrede Herbert | $25,000 |
Source: Public Records
Tax History Compared to Growth
Tax History
| Year | Tax Paid | Tax Assessment Tax Assessment Total Assessment is a certain percentage of the fair market value that is determined by local assessors to be the total taxable value of land and additions on the property. | Land | Improvement |
|---|---|---|---|---|
| 2024 | $3,380 | $71,995 | $15,120 | $56,875 |
| 2023 | $4,114 | $65,700 | $14,420 | $51,280 |
| 2022 | $4,084 | $65,695 | $14,420 | $51,275 |
| 2021 | $4,052 | $65,700 | $14,420 | $51,280 |
| 2020 | $3,755 | $53,870 | $11,830 | $42,040 |
| 2019 | $3,645 | $153,900 | $33,800 | $120,100 |
| 2018 | $3,256 | $53,870 | $11,830 | $42,040 |
| 2017 | $3,263 | $49,180 | $9,000 | $40,180 |
| 2016 | $3,236 | $49,180 | $9,000 | $40,180 |
| 2015 | $3,349 | $49,180 | $9,000 | $40,180 |
| 2014 | $3,349 | $50,190 | $9,170 | $41,020 |
Source: Public Records
Map
Nearby Homes
- 19240 Briarwood Ln
- 11432 Pearl Rd
- 11499 Pearl Rd Unit A106
- 11179 Fawn Meadow Ln
- 10986 Fawn Meadow Ln
- 19890 Idlewood Trail
- 19997 Idlewood Trail
- 20050 Idlewood Trail
- 12385 Corinth Ct
- 18336 Falling Water Rd
- 12539 Olympus Way
- 11650 River Moss Rd
- 12647 Edgepark Cir
- 12694 Ionia Ct
- 20424 Scotch Pine Way
- 18248 Meadow Ln
- 13066 Olympus Way
- 13099 Olympus Way
- 17945 Cliffside Dr
- 13156 Olympus Way
- 11361 Co Moor Blvd
- 11401 Co Moor Blvd
- 11343 Co Moor Blvd
- 11425 Co Moor Blvd
- 11325 Co Moor Blvd
- 11443 Co Moor Blvd
- 11386 Co Moor Blvd
- 11306 Pearl Rd
- 11307 Co Moor Blvd
- 11368 Co Moor Blvd
- 11350 Co Moor Blvd
- 11461 Co Moor Blvd
- 11289 Co Moor Blvd
- 11294 Co Moor Blvd
- 11332 Co Moor Blvd
- 11422 Co Moor Blvd
- 11289 Comoor Blvd
- 11479 Co Moor Blvd
- 11440 Co Moor Blvd
- 11266 Co Moor Blvd