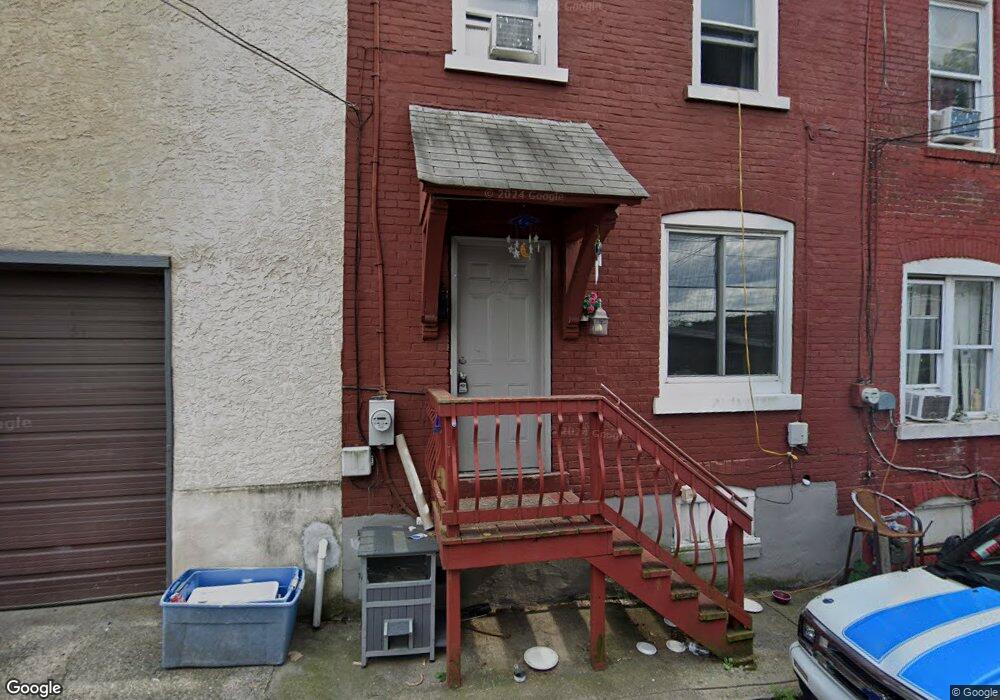
1138 Amplex St Bethlehem, PA 18015
Downtown Bethlehem NeighborhoodEstimated Value: $129,000 - $166,000
3
Beds
1
Bath
1,016
Sq Ft
$144/Sq Ft
Est. Value
About This Home
This home is located at 1138 Amplex St, Bethlehem, PA 18015 and is currently estimated at $145,980, approximately $143 per square foot. 1138 Amplex St is a home located in Northampton County with nearby schools including Donegan Elementary School, Broughal Middle School, and Freedom High School.
Ownership History
Date
Name
Owned For
Owner Type
Purchase Details
Closed on
Sep 12, 2006
Sold by
Vazquez Hector L
Bought by
Ramirez Iris R
Current Estimated Value
Home Financials for this Owner
Home Financials are based on the most recent Mortgage that was taken out on this home.
Original Mortgage
$60,300
Outstanding Balance
$36,291
Interest Rate
6.71%
Mortgage Type
New Conventional
Estimated Equity
$109,689
Create a Home Valuation Report for This Property
The Home Valuation Report is an in-depth analysis detailing your home's value as well as a comparison with similar homes in the area
Home Values in the Area
Average Home Value in this Area
Purchase History
| Date | Buyer | Sale Price | Title Company |
|---|---|---|---|
| Ramirez Iris R | $67,000 | -- |
Source: Public Records
Mortgage History
| Date | Status | Borrower | Loan Amount |
|---|---|---|---|
| Open | Ramirez Iris R | $60,300 |
Source: Public Records
Tax History
| Year | Tax Paid | Tax Assessment Tax Assessment Total Assessment is a certain percentage of the fair market value that is determined by local assessors to be the total taxable value of land and additions on the property. | Land | Improvement |
|---|---|---|---|---|
| 2025 | $212 | $19,600 | $5,200 | $14,400 |
| 2024 | $1,732 | $19,600 | $5,200 | $14,400 |
| 2023 | $1,732 | $19,600 | $5,200 | $14,400 |
| 2022 | $1,719 | $19,600 | $5,200 | $14,400 |
| 2021 | $1,707 | $19,600 | $5,200 | $14,400 |
| 2020 | $1,691 | $19,600 | $5,200 | $14,400 |
| 2019 | $1,685 | $19,600 | $5,200 | $14,400 |
| 2018 | $1,644 | $19,600 | $5,200 | $14,400 |
| 2017 | $1,625 | $19,600 | $5,200 | $14,400 |
| 2016 | -- | $19,600 | $5,200 | $14,400 |
| 2015 | -- | $19,600 | $5,200 | $14,400 |
| 2014 | -- | $19,600 | $5,200 | $14,400 |
Source: Public Records
Map
Nearby Homes
Your Personal Tour Guide
Ask me questions while you tour the home.