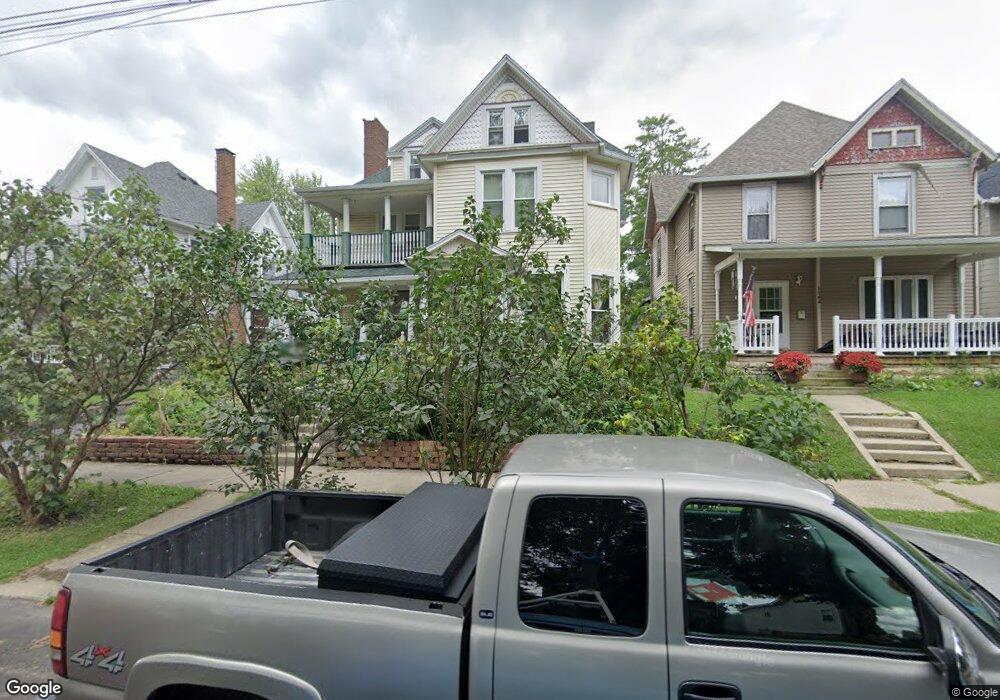
1138 Byron St Huntington, IN 46750
Estimated Value: $186,000 - $268,000
5
Beds
3
Baths
4,828
Sq Ft
$45/Sq Ft
Est. Value
About This Home
This home is located at 1138 Byron St, Huntington, IN 46750 and is currently estimated at $215,395, approximately $44 per square foot. 1138 Byron St is a home located in Huntington County with nearby schools including Flint Springs Elementary School, Crestview Middle School, and Huntington North High School.
Ownership History
Date
Name
Owned For
Owner Type
Purchase Details
Closed on
Mar 23, 2011
Sold by
Us Bank National Association
Bought by
Slawinski James and Slawinksi Yelena
Current Estimated Value
Purchase Details
Closed on
Jun 8, 2010
Sold by
Richards James P
Bought by
Us Bank Na
Purchase Details
Closed on
May 3, 2005
Sold by
Tackett Randell E and Tackett Carol A
Bought by
Richards James P and Richards Stephanie M
Home Financials for this Owner
Home Financials are based on the most recent Mortgage that was taken out on this home.
Original Mortgage
$10,390
Interest Rate
6.2%
Mortgage Type
Adjustable Rate Mortgage/ARM
Create a Home Valuation Report for This Property
The Home Valuation Report is an in-depth analysis detailing your home's value as well as a comparison with similar homes in the area
Home Values in the Area
Average Home Value in this Area
Purchase History
| Date | Buyer | Sale Price | Title Company |
|---|---|---|---|
| Slawinski James | $50,000 | Investors Titlecorp | |
| Us Bank Na | $101,250 | None Available | |
| Richards James P | -- | None Available |
Source: Public Records
Mortgage History
| Date | Status | Borrower | Loan Amount |
|---|---|---|---|
| Previous Owner | Richards James P | $10,390 |
Source: Public Records
Tax History Compared to Growth
Tax History
| Year | Tax Paid | Tax Assessment Tax Assessment Total Assessment is a certain percentage of the fair market value that is determined by local assessors to be the total taxable value of land and additions on the property. | Land | Improvement |
|---|---|---|---|---|
| 2024 | $1,587 | $158,700 | $8,200 | $150,500 |
| 2023 | $1,587 | $158,700 | $8,200 | $150,500 |
| 2022 | $1,393 | $139,300 | $8,200 | $131,100 |
| 2021 | $1,358 | $135,800 | $8,200 | $127,600 |
| 2020 | $1,242 | $124,200 | $8,200 | $116,000 |
| 2019 | $1,281 | $128,100 | $8,200 | $119,900 |
| 2018 | $1,244 | $124,400 | $8,200 | $116,200 |
| 2017 | $1,236 | $123,600 | $8,200 | $115,400 |
| 2016 | $1,345 | $134,500 | $8,200 | $126,300 |
| 2014 | $1,289 | $128,900 | $8,200 | $120,700 |
| 2013 | $1,289 | $131,700 | $8,200 | $123,500 |
Source: Public Records
Map
Nearby Homes
- 928 Guilford St
- 1035 N Jefferson St
- 636 Division St
- 736 Woodlawn Ave
- 1535 Byron St
- 1134 Cherry St
- 807 Kintz St
- 1540 Freedom St
- 644 First St
- 508 E Market St
- 534 Poplar St
- 1726 Guilford St
- 615 North St
- 503 Court St
- 435 W Park Dr
- 736 N Lafontaine St
- 325 N Lafontaine St
- 1020 N Lafontaine St
- 1433 Poplar St
- 1914 Guilford St