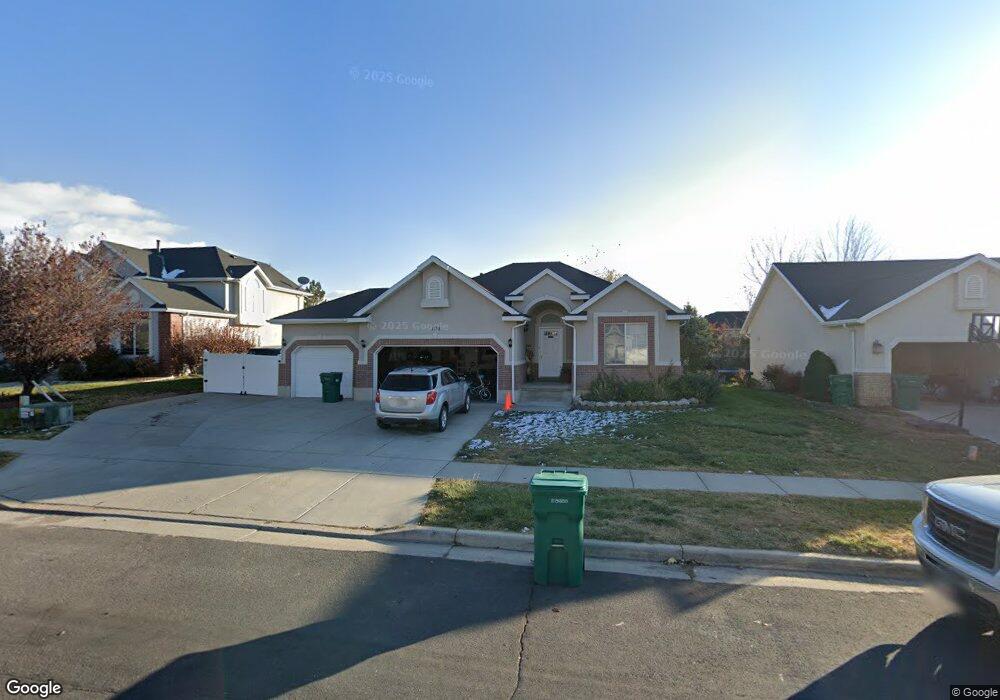
1138 E 2675 N Layton, UT 84040
Estimated Value: $583,000 - $633,000
5
Beds
3
Baths
3,020
Sq Ft
$204/Sq Ft
Est. Value
About This Home
This home is located at 1138 E 2675 N, Layton, UT 84040 and is currently estimated at $615,527, approximately $203 per square foot. 1138 E 2675 N is a home located in Davis County with nearby schools including Sarah Jane Adams Elementary School, North Layton Junior High School, and Northridge High School.
Ownership History
Date
Name
Owned For
Owner Type
Purchase Details
Closed on
Aug 20, 2025
Sold by
Cook Kenneth Tyler
Bought by
Cook Kenneth Tyler and Rose Diane Elaine
Current Estimated Value
Purchase Details
Closed on
Oct 21, 2020
Sold by
Nguyen Jeff
Bought by
Cook Kenneth Tyler
Purchase Details
Closed on
Nov 16, 2019
Sold by
Younger Ada M and Younger Anthony
Bought by
Nguyen Jeff
Home Financials for this Owner
Home Financials are based on the most recent Mortgage that was taken out on this home.
Original Mortgage
$354,350
Interest Rate
3.65%
Mortgage Type
New Conventional
Purchase Details
Closed on
May 13, 2019
Sold by
Younger Anthony Eric and Younger Ada M
Bought by
Younger Anthony E and Younger Ada M
Purchase Details
Closed on
Jan 26, 2000
Sold by
Younger Anthony Eric and Younger Ada M
Bought by
Younger Eric and Younger Ada M
Purchase Details
Closed on
Jun 21, 1999
Sold by
Gmw Development Inc
Bought by
Younger Anthony Eric and Younger Ada M
Create a Home Valuation Report for This Property
The Home Valuation Report is an in-depth analysis detailing your home's value as well as a comparison with similar homes in the area
Home Values in the Area
Average Home Value in this Area
Purchase History
| Date | Buyer | Sale Price | Title Company |
|---|---|---|---|
| Cook Kenneth Tyler | -- | Truly Title | |
| Cook Kenneth Tyler | -- | Backman Title Service | |
| Nguyen Jeff | -- | Northern Title Co L | |
| Younger Anthony E | -- | Northern Title Co Logan | |
| Younger Eric | -- | -- | |
| Younger Anthony Eric | -- | Bonneville Title Company Inc | |
| Gmw Development Inc | -- | Bonneville Title Company Inc |
Source: Public Records
Mortgage History
| Date | Status | Borrower | Loan Amount |
|---|---|---|---|
| Previous Owner | Nguyen Jeff | $354,350 |
Source: Public Records
Tax History
| Year | Tax Paid | Tax Assessment Tax Assessment Total Assessment is a certain percentage of the fair market value that is determined by local assessors to be the total taxable value of land and additions on the property. | Land | Improvement |
|---|---|---|---|---|
| 2025 | $3,378 | $330,000 | $118,147 | $211,853 |
| 2024 | $3,159 | $312,400 | $143,037 | $169,363 |
| 2023 | $3,138 | $552,000 | $195,288 | $356,712 |
| 2022 | $3,180 | $305,250 | $104,537 | $200,713 |
| 2021 | $2,944 | $421,000 | $158,754 | $262,246 |
| 2020 | $4,439 | $342,000 | $127,193 | $214,807 |
| 2019 | $2,314 | $310,000 | $113,913 | $196,087 |
| 2018 | $2,273 | $307,000 | $71,479 | $235,521 |
| 2016 | $2,050 | $144,925 | $35,443 | $109,482 |
| 2015 | $2,099 | $140,415 | $35,443 | $104,972 |
| 2014 | $2,143 | $149,080 | $35,443 | $113,637 |
| 2013 | -- | $153,162 | $40,962 | $112,200 |
Source: Public Records
Map
Nearby Homes
- 1447 E 2700 N
- 948 E Hercules Ct Unit 179
- 1241 E 3075 N
- 2315 N 1075 E
- 1266 E 3125 N
- 1444 E 2400 N
- 2826 N 1600 E
- 1321 E 3125 N
- 3142 E Thorley Dr
- 3138 E Thorley Dr
- 935 E 3000 N Unit 183
- 935 E 3000 N Unit 175
- 935 E 3000 N Unit 165
- 935 E 3000 N Unit 26
- 935 E 3000 N Unit 90
- 935 E 3000 N Unit 27
- 935 E Highway 193 Unit 102
- 935 E 3000 N Unit 56
- 1120 E 2200 N
- 3176 N 1450 E
Your Personal Tour Guide
Ask me questions while you tour the home.