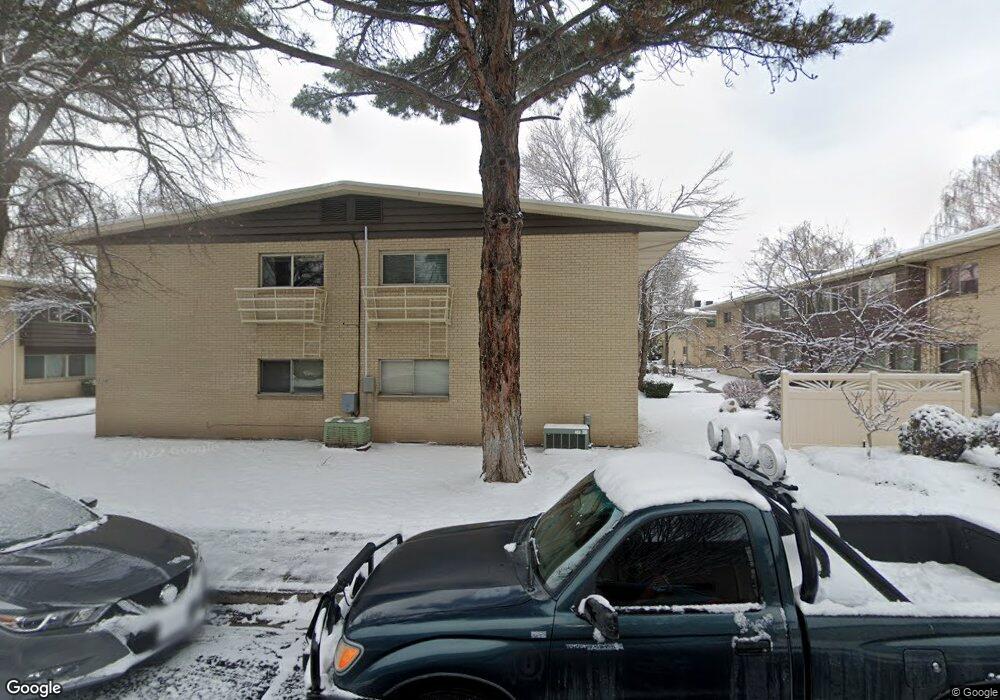
1138 E 2700 S Unit F43 Salt Lake City, UT 84106
Sugar House NeighborhoodEstimated Value: $328,000 - $373,000
2
Beds
1
Bath
1,175
Sq Ft
$297/Sq Ft
Est. Value
About This Home
This home is located at 1138 E 2700 S Unit F43, Salt Lake City, UT 84106 and is currently estimated at $349,319, approximately $297 per square foot. 1138 E 2700 S Unit F43 is a home located in Salt Lake County with nearby schools including Nibley Park School, Highland High School, and Carden Memorial School.
Ownership History
Date
Name
Owned For
Owner Type
Purchase Details
Closed on
Jul 8, 2009
Sold by
Howarth Larue E
Bought by
Behrens Sarah
Current Estimated Value
Home Financials for this Owner
Home Financials are based on the most recent Mortgage that was taken out on this home.
Original Mortgage
$126,170
Outstanding Balance
$83,510
Interest Rate
5.59%
Mortgage Type
FHA
Estimated Equity
$265,809
Purchase Details
Closed on
Apr 19, 2007
Sold by
Howarth Larue E
Bought by
Howarth Larue E
Home Financials for this Owner
Home Financials are based on the most recent Mortgage that was taken out on this home.
Original Mortgage
$205,500
Interest Rate
5.97%
Mortgage Type
Reverse Mortgage Home Equity Conversion Mortgage
Purchase Details
Closed on
Mar 21, 2001
Sold by
Hansen D Maurice and Estate Of Beth G Hansen
Bought by
Howarth Larue E
Purchase Details
Closed on
Feb 6, 1996
Sold by
Hansen Beth G and Thompson Suzanne E
Bought by
Hansen Beth G
Home Financials for this Owner
Home Financials are based on the most recent Mortgage that was taken out on this home.
Original Mortgage
$126,000
Interest Rate
7.01%
Create a Home Valuation Report for This Property
The Home Valuation Report is an in-depth analysis detailing your home's value as well as a comparison with similar homes in the area
Home Values in the Area
Average Home Value in this Area
Purchase History
| Date | Buyer | Sale Price | Title Company |
|---|---|---|---|
| Behrens Sarah | -- | Equity Title | |
| Howarth Larue E | -- | Equity Title | |
| Howarth Larue E | -- | -- | |
| Hansen Beth G | -- | -- |
Source: Public Records
Mortgage History
| Date | Status | Borrower | Loan Amount |
|---|---|---|---|
| Open | Behrens Sarah | $126,170 | |
| Previous Owner | Howarth Larue E | $205,500 | |
| Previous Owner | Hansen Beth G | $126,000 |
Source: Public Records
Tax History Compared to Growth
Tax History
| Year | Tax Paid | Tax Assessment Tax Assessment Total Assessment is a certain percentage of the fair market value that is determined by local assessors to be the total taxable value of land and additions on the property. | Land | Improvement |
|---|---|---|---|---|
| 2025 | $1,524 | $274,700 | $82,400 | $192,300 |
| 2024 | $1,524 | $290,800 | $87,200 | $203,600 |
| 2023 | $1,477 | $271,700 | $81,500 | $190,200 |
| 2022 | $1,636 | $282,300 | $84,700 | $197,600 |
| 2021 | $1,345 | $210,200 | $63,000 | $147,200 |
| 2020 | $1,260 | $187,400 | $56,200 | $131,200 |
| 2019 | $1,244 | $174,100 | $52,200 | $121,900 |
| 2018 | $1,152 | $157,000 | $47,100 | $109,900 |
| 2017 | $1,106 | $0 | $0 | $0 |
| 2016 | $1,035 | $125,400 | $37,600 | $87,800 |
| 2015 | $1,039 | $119,400 | $35,800 | $83,600 |
| 2014 | $1,037 | $118,200 | $35,400 | $82,800 |
Source: Public Records
Map
Nearby Homes
- 1152 E 2700 S Unit S148
- 1150 E 2700 S Unit G51
- 1150 E 2700 S Unit 50G
- 1192 E 2700 S
- 1130 E 2700 S Unit K83
- 2710 S Highland Dr Unit 11
- 2760 S Highland Dr Unit 21
- 2760 S Highland Dr Unit 20
- 2594 S Elizabeth St
- 2584 S Elizabeth St Unit 5
- 1314 E Crandall Ave
- 1278 E Hudson Ave
- 2970 S Richmond St
- 2865 S 1335 E
- 1371 E Zenith Ave
- 2937 S 900 E
- 2438 S Elizabeth St Unit 2
- 2430 S Elizabeth St Unit 5
- 1168 E Parkway Ave
- 1978 S Windsor Cir
- 1138 E 2700 S Unit F41
- 1138 E 2700 S Unit F48
- 1138 E 2700 S Unit F44
- 1138 E 2700 S Unit F47
- 1138 E 2700 S Unit F46
- 1138 E 2700 S Unit F45
- 1138 E 2700 S
- 1138 E 2700 S Unit 47F
- 1138 E 2700 S Unit 48-F
- 1152 E 2700 S Unit S145
- 1152 E 2700 S Unit S147
- 1152 E 2700 S Unit S146
- 1152 E 2700 S Unit S150
- 1152 E 2700 S Unit S152
- 1152 E 2700 S Unit S151
- 1152 E 2700 S Unit S149
- 1134 E 2700 S Unit D27
- 1134 E 2700 S Unit D32
- 1134 E 2700 S Unit D28
- 1134 E 2700 S Unit D31