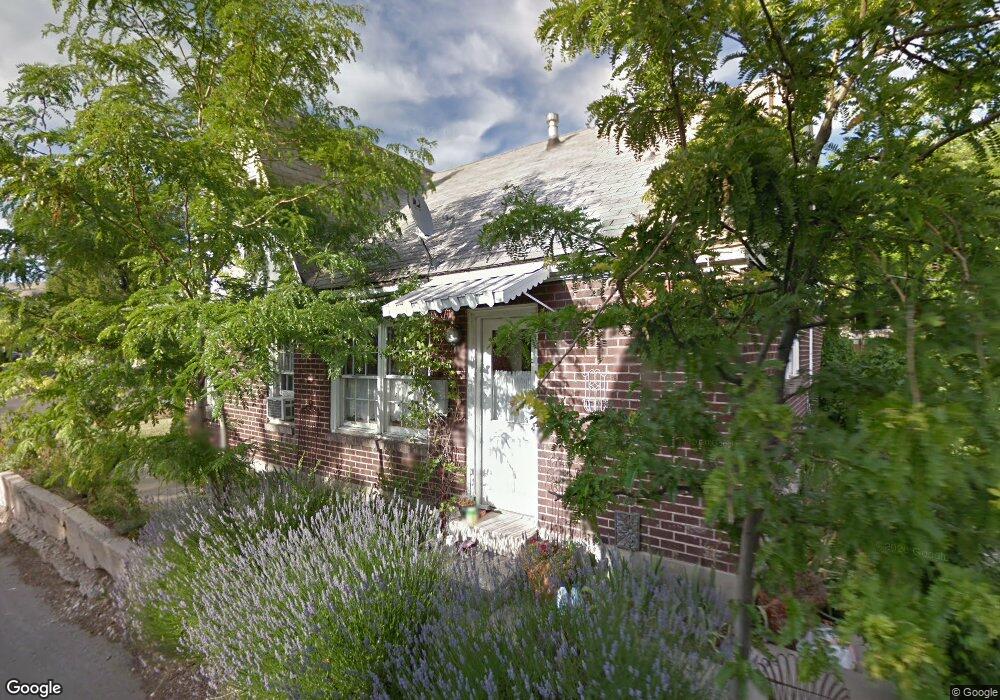
1138 E 400 S Salt Lake City, UT 84102
East Central NeighborhoodEstimated Value: $619,000 - $727,764
3
Beds
1
Bath
1,383
Sq Ft
$474/Sq Ft
Est. Value
About This Home
This home is located at 1138 E 400 S, Salt Lake City, UT 84102 and is currently estimated at $655,691, approximately $474 per square foot. 1138 E 400 S is a home located in Salt Lake County with nearby schools including Bennion Elementary School, Wasatch Elementary School, and East High School.
Ownership History
Date
Name
Owned For
Owner Type
Purchase Details
Closed on
Jun 17, 2022
Sold by
Coronado David
Bought by
Coronado David and Hill Kathleen J
Current Estimated Value
Purchase Details
Closed on
Dec 28, 2016
Sold by
Hill Kathleen J
Bought by
Coronado David
Home Financials for this Owner
Home Financials are based on the most recent Mortgage that was taken out on this home.
Original Mortgage
$258,400
Interest Rate
4.03%
Mortgage Type
New Conventional
Purchase Details
Closed on
Jun 24, 2004
Sold by
Mann M L
Bought by
Hill Kathleen J
Home Financials for this Owner
Home Financials are based on the most recent Mortgage that was taken out on this home.
Original Mortgage
$149,400
Interest Rate
8.55%
Mortgage Type
Unknown
Create a Home Valuation Report for This Property
The Home Valuation Report is an in-depth analysis detailing your home's value as well as a comparison with similar homes in the area
Home Values in the Area
Average Home Value in this Area
Purchase History
| Date | Buyer | Sale Price | Title Company |
|---|---|---|---|
| Coronado David | -- | Old Republic Title | |
| Coronado David | -- | Cottonwood Title | |
| Hill Kathleen J | -- | United Title Services |
Source: Public Records
Mortgage History
| Date | Status | Borrower | Loan Amount |
|---|---|---|---|
| Previous Owner | Coronado David | $258,400 | |
| Previous Owner | Hill Kathleen J | $149,400 |
Source: Public Records
Tax History Compared to Growth
Tax History
| Year | Tax Paid | Tax Assessment Tax Assessment Total Assessment is a certain percentage of the fair market value that is determined by local assessors to be the total taxable value of land and additions on the property. | Land | Improvement |
|---|---|---|---|---|
| 2025 | $3,208 | $640,200 | $250,500 | $389,700 |
| 2024 | $3,208 | $612,100 | $239,000 | $373,100 |
| 2023 | $3,116 | $573,000 | $229,800 | $343,200 |
| 2022 | $3,247 | $560,200 | $225,300 | $334,900 |
| 2021 | $2,619 | $409,100 | $183,000 | $226,100 |
| 2020 | $2,668 | $396,800 | $171,100 | $225,700 |
| 2019 | $2,756 | $385,600 | $160,100 | $225,500 |
| 2018 | $2,734 | $372,500 | $160,100 | $212,400 |
| 2017 | $2,624 | $334,900 | $160,100 | $174,800 |
| 2016 | $2,723 | $330,000 | $135,500 | $194,500 |
| 2015 | $2,195 | $252,200 | $119,800 | $132,400 |
| 2014 | $1,807 | $205,900 | $119,800 | $86,100 |
Source: Public Records
Map
Nearby Homes
- 1116 E 400 S
- 1162 E 400 S
- 405 S 1100 E
- 365 S Elizabeth St
- 359 S 1100 E
- 447 S 1200 E
- 1044 E 400 S Unit 308A
- 1044 E 400 S Unit 407A
- 425 S 1000 E Unit 204C
- 551 S Mcclelland St
- 554 S Douglas St
- 426 S 1000 E Unit 707
- 426 S 1000 E Unit 600
- 515 S 1000 E Unit 406
- 515 S 1000 E Unit 504
- 515 S 1000 E Unit 706
- 515 S 1000 E Unit 1104
- 243 S Elizabeth St
- 552 S Mcclelland St
- 1233 E 600 S