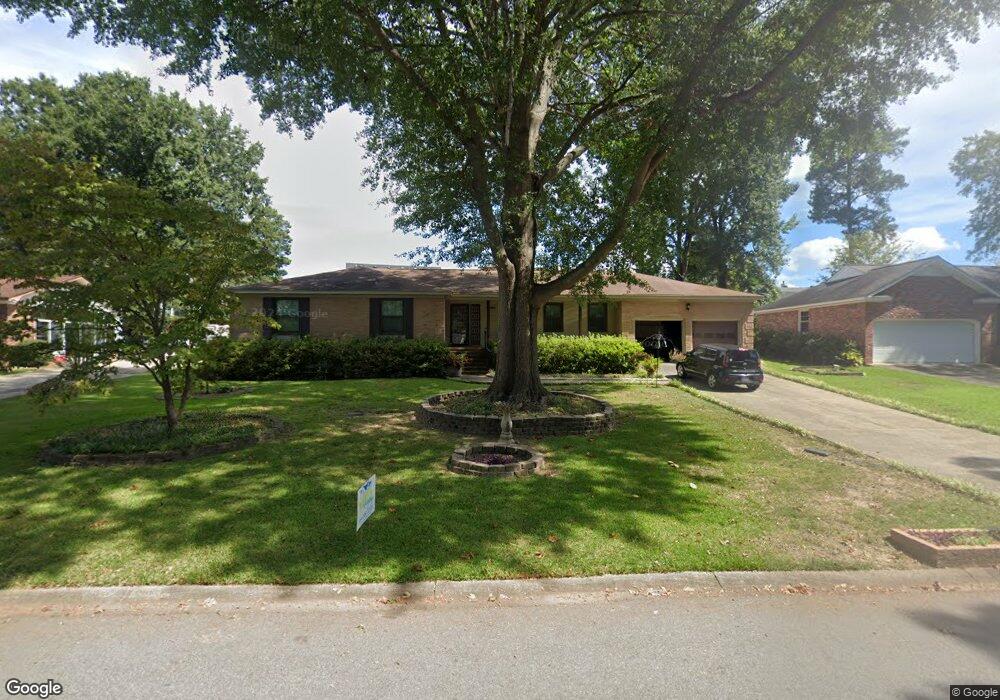
1138 Greenvalley Ln Columbia, SC 29210
Seven Oaks NeighborhoodEstimated Value: $206,000 - $267,000
4
Beds
2
Baths
1,970
Sq Ft
$119/Sq Ft
Est. Value
About This Home
This home is located at 1138 Greenvalley Ln, Columbia, SC 29210 and is currently estimated at $234,264, approximately $118 per square foot. 1138 Greenvalley Ln is a home located in Lexington County with nearby schools including Seven Oaks Elementary School, Irmo Middle, and Irmo High.
Ownership History
Date
Name
Owned For
Owner Type
Purchase Details
Closed on
Jul 9, 2024
Sold by
Hallman Frances E
Bought by
Sproul Charlene A and Sproul Calvert B
Current Estimated Value
Purchase Details
Closed on
Jun 8, 2020
Sold by
Griffith Craig Allen
Bought by
Hallman Frances E
Purchase Details
Closed on
May 29, 2020
Sold by
Estes Alice F
Bought by
Hallman Frances E
Purchase Details
Closed on
May 18, 2020
Sold by
Estes William Franklyn
Bought by
Hallman Frances E
Purchase Details
Closed on
Apr 3, 2020
Sold by
Estes William Franklyn and Estate Of Vance Ricky Griffith
Bought by
Estes William Franklin and Griffith Craig Allen
Purchase Details
Closed on
Oct 25, 2019
Sold by
Hallman Frances E and Estate Of Donna Estes Griffith
Bought by
Griffith Vance R
Purchase Details
Closed on
Feb 20, 2006
Sold by
Hallman Frances Estes and Estes Frances Kay
Bought by
Griffith Donna E and Estes Alice F
Create a Home Valuation Report for This Property
The Home Valuation Report is an in-depth analysis detailing your home's value as well as a comparison with similar homes in the area
Home Values in the Area
Average Home Value in this Area
Purchase History
| Date | Buyer | Sale Price | Title Company |
|---|---|---|---|
| Sproul Charlene A | $206,750 | None Listed On Document | |
| Sproul Charlene A | $206,750 | None Listed On Document | |
| Hallman Frances E | -- | None Available | |
| Hallman Frances E | -- | None Available | |
| Hallman Frances E | -- | None Available | |
| Estes William Franklin | -- | None Available | |
| Griffith Vance R | -- | None Available | |
| Griffith Donna E | -- | None Available |
Source: Public Records
Tax History Compared to Growth
Tax History
| Year | Tax Paid | Tax Assessment Tax Assessment Total Assessment is a certain percentage of the fair market value that is determined by local assessors to be the total taxable value of land and additions on the property. | Land | Improvement |
|---|---|---|---|---|
| 2024 | $1,611 | $9,542 | $1,500 | $8,042 |
| 2023 | $4,135 | $6,361 | $1,000 | $5,361 |
| 2022 | $995 | $6,361 | $1,000 | $5,361 |
| 2020 | $639 | $9,542 | $1,500 | $8,042 |
| 2019 | $588 | $5,957 | $880 | $5,077 |
| 2018 | $509 | $5,957 | $880 | $5,077 |
| 2017 | $491 | $5,957 | $880 | $5,077 |
| 2016 | $514 | $5,956 | $880 | $5,076 |
| 2014 | $519 | $5,947 | $1,000 | $4,947 |
| 2013 | -- | $5,950 | $1,000 | $4,950 |
Source: Public Records
Map
Nearby Homes
- 117 Beth Hope Ln
- 1115 Gardendale Dr
- 717 Shadow Mist Ln
- 1722 Bush River Rd
- 299 Westlawn Rd
- 126 Silvermill Rd
- 2412 Pine Tops Rd
- 3725 Harrogate Rd
- 107 Southwell Rd
- 3700 Bush River Rd Unit K-3
- 3700 Bush River Rd Unit I3
- 3700 Bush River Rd Unit F2
- 169 King George Way
- 163 Cheshire Dr
- 139 Cheshire Dr
- 227 N Stonehedge Dr
- 412 Winstaire Dr
- 121 Barmount Dr
- 233 Barmount Dr
- 2637 Pine Lake Dr
- 1140 Greenvalley Ln
- 1136 Greenvalley Ln
- 111 Sumner Ct
- 107 Sumner Ct
- lot 1 Greenvalley Ln
- 112 Sumner Ct
- 1134 Greenvalley Ln
- 1137 Greenvalley Ln
- 1139 Greenvalley Ln
- 840 Tara Trail
- 104 Bella Ct
- 1135 Greenvalley Ln
- 123 Beth Hope Ln
- 108 Sumner Ct
- 1141 Greenvalley Ln
- 108 Bella Ct
- 838 Tara Trail
- 1133 Greenvalley Ln
- 1132 Greenvalley Ln
- 104 Sumner Ct