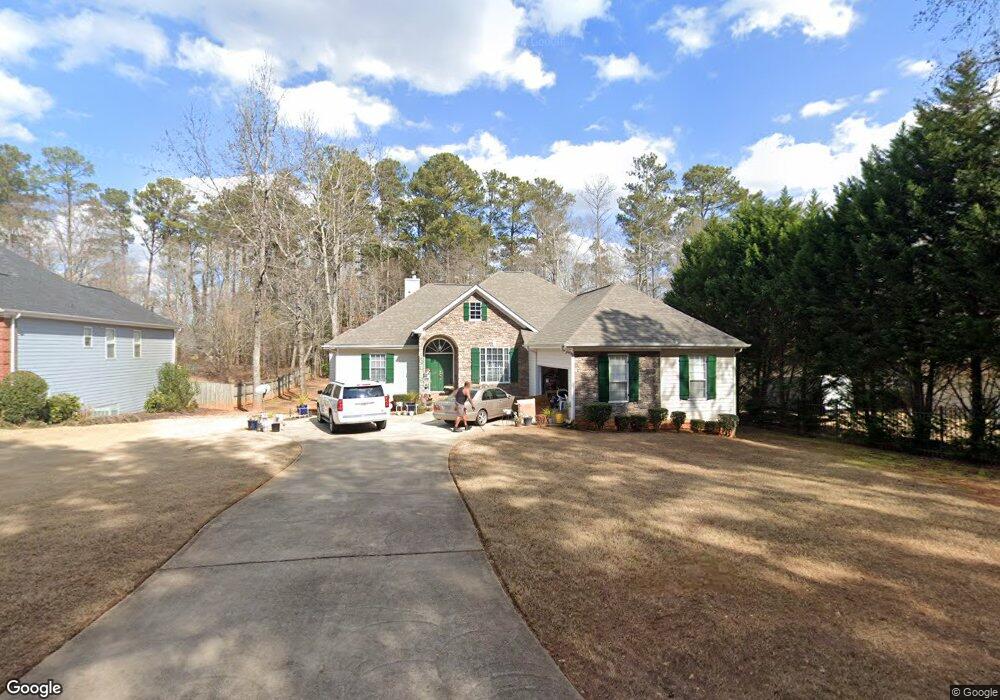
1138 Kay Terrace SE Conyers, GA 30013
Estimated Value: $287,915 - $341,000
3
Beds
3
Baths
2,039
Sq Ft
$156/Sq Ft
Est. Value
About This Home
This home is located at 1138 Kay Terrace SE, Conyers, GA 30013 and is currently estimated at $317,479, approximately $155 per square foot. 1138 Kay Terrace SE is a home located in Rockdale County with nearby schools including Honey Creek Elementary School, Memorial Middle School, and Salem High School.
Ownership History
Date
Name
Owned For
Owner Type
Purchase Details
Closed on
Mar 31, 2016
Sold by
Rose Bilalian
Bought by
Rose Bilalian
Current Estimated Value
Home Financials for this Owner
Home Financials are based on the most recent Mortgage that was taken out on this home.
Original Mortgage
$164,320
Outstanding Balance
$130,671
Interest Rate
3.71%
Estimated Equity
$186,808
Purchase Details
Closed on
Sep 18, 2002
Sold by
Jones Chantelle
Bought by
Bilalian Rose
Home Financials for this Owner
Home Financials are based on the most recent Mortgage that was taken out on this home.
Original Mortgage
$199,500
Interest Rate
6.19%
Mortgage Type
New Conventional
Purchase Details
Closed on
May 22, 2001
Sold by
Kerbow Const
Bought by
Jones Chantelle
Home Financials for this Owner
Home Financials are based on the most recent Mortgage that was taken out on this home.
Original Mortgage
$149,600
Interest Rate
7.6%
Mortgage Type
New Conventional
Create a Home Valuation Report for This Property
The Home Valuation Report is an in-depth analysis detailing your home's value as well as a comparison with similar homes in the area
Home Values in the Area
Average Home Value in this Area
Purchase History
| Date | Buyer | Sale Price | Title Company |
|---|---|---|---|
| Rose Bilalian | -- | -- | |
| Bilalian Rose | $210,000 | -- | |
| Jones Chantelle | $187,000 | -- |
Source: Public Records
Mortgage History
| Date | Status | Borrower | Loan Amount |
|---|---|---|---|
| Open | Rose Bilalian | $164,320 | |
| Closed | Rose Bilalian | -- | |
| Previous Owner | Bilalian Rose | $199,500 | |
| Previous Owner | Jones Chantelle | $149,600 |
Source: Public Records
Tax History Compared to Growth
Tax History
| Year | Tax Paid | Tax Assessment Tax Assessment Total Assessment is a certain percentage of the fair market value that is determined by local assessors to be the total taxable value of land and additions on the property. | Land | Improvement |
|---|---|---|---|---|
| 2024 | $1,940 | $110,040 | $27,080 | $82,960 |
| 2023 | $989 | $77,720 | $15,600 | $62,120 |
| 2022 | $1,213 | $74,160 | $15,600 | $58,560 |
| 2021 | $1,288 | $74,160 | $15,600 | $58,560 |
| 2020 | $1,283 | $74,160 | $15,600 | $58,560 |
| 2019 | $1,104 | $66,960 | $8,400 | $58,560 |
| 2018 | $1,111 | $66,960 | $8,400 | $58,560 |
| 2017 | $983 | $62,480 | $8,400 | $54,080 |
| 2016 | $1,064 | $69,240 | $8,400 | $60,840 |
| 2015 | $1,064 | $69,240 | $8,400 | $60,840 |
| 2014 | $891 | $69,240 | $8,400 | $60,840 |
| 2013 | -- | $73,120 | $11,200 | $61,920 |
Source: Public Records
Map
Nearby Homes
- 2754 Harvest Dr SE
- 2684 Harvest Dr SE
- 1115 Fountain Crest Dr
- 917 Curry Cir SE
- 1260 Sweet Shrub Ln SE
- 1613 Brolington Ct
- 1920 Logan Ln
- 1813 Holmsey Cir
- 1388 Fall River Dr
- 2924 Raintree Dr SE
- 820 Bridgewater Way SE
- 2923 Raintree Dr SE
- 812 Raintree Way SE
- 2791 Wellington Way SE Unit 1
- 1135 Vineyard Dr SE
- 2474 Harvest Dr SE
- 693 Deering Rd SE
- 2561 Old Salem Cir SE
- 784 Stieff Ct SE
- 3180 Highway 20 SE
- 1144 Kay Terrace SE Unit 206
- 1144 Kay Terrace SE Unit 1144
- 1144 Kay Terrace SE
- 1132 Kay Terrace SE
- 1126 Kay Terrace SE
- 1150 Kay Terrace SE
- 1120 Kay Terrace SE
- 1160 Kay Terrace SE
- 2773 Harvest Dr SE
- 2763 Harvest Dr SE
- 2783 Harvest Dr SE Unit 2
- 1114 Kay Terrace SE
- 2753 Harvest Dr SE
- 2753 Harvest Dr SE Unit 14
- 2830 Georgia 20
- 2796 Georgia 20
- 2743 Harvest Dr SE
- 1180 Kay Terrace SE
- 2774 Harvest Dr SE
- 2748 Harvest Dr SE